
Introduction: The Hidden Reality Behind Every SIP
Investing through SIPs (Systematic Investment Plans) has become the default path to wealth creation for Indian investors. Over 7 crore SIP accounts contribute nearly ₹20,000 crore every month (as per AMFI, 2025).
While SIPs promise long-term growth, compounding, and discipline, there’s a harsh reality many investors overlook — drawdowns.
Even the most successful SIP portfolios don’t rise in a straight line. They face temporary but painful declines — sometimes as much as 20% or more.
Table of Contents
This article breaks down how often such drawdowns happen, why they occur, and what you can do to emotionally and financially prepare for them. We’ll use real Indian market data, expert insights, and futuristic projections (2025–2035) to guide you.
What Is a Drawdown — and Why Does It Matter?
A drawdown represents the peak-to-trough decline in your portfolio’s value.
For example, if your SIP portfolio peaks at ₹10 lakh and drops to ₹8 lakh, that’s a 20% drawdown.
In SIP investing, drawdowns matter because:
- They test your discipline and emotional control.
- They determine whether you stay invested or panic-sell.
- They influence your long-term returns more than short-term gains.
As legendary investor Peter Lynch once said:
“The key to making money in stocks is not to get scared out of them.”
In short — drawdowns separate investors from speculators.
Table 1: Typical Drawdowns in Indian Equity Markets
| Market Index | Average Drawdown (5-Year Period) | Severe Drawdown (Crash Years) | Recovery Time |
|---|---|---|---|
| Nifty 50 | -12% | -38% (Mar 2020) | 9–12 months |
| Sensex | -10% | -36% (Mar 2020) | 10 months |
| Nifty Midcap 150 | -18% | -50% (2018–2020) | 18–24 months |
| Nifty Smallcap 250 | -25% | -60% (2018–2020) | 2–3 years |
Why SIP Portfolios Experience 20% Drawdowns
Even though SIPs average out volatility, they don’t eliminate it. Here’s why you might still see temporary 20% dips:
1. Market Cycles
Markets move in bull and bear phases.
During bear markets (like 2008, 2020, or 2022), even top funds saw 25–40% declines.
2. Sector Rotation
Your SIP might be heavy in a sector (like IT, Banking, or Energy). When that sector underperforms, your SIP returns drop — even if other sectors do well.
3. Global Events
Events like the Russia-Ukraine war, COVID-19 pandemic, or US interest rate hikes can trigger global corrections impacting Indian markets.
4. Recency Bias
Investors often forget that markets move in cycles. A 2-year bull run makes people overconfident, but history shows 20% corrections are normal — not exceptions.
Table 2: Historical SIP Drawdowns (2008–2025)
| Year | Market Event | Typical SIP Portfolio Decline | Duration | Recovery Period |
|---|---|---|---|---|
| 2008 | Global Financial Crisis | -35% | 12 months | 18 months |
| 2013 | Taper Tantrum | -15% | 4 months | 6 months |
| 2020 | COVID-19 Crash | -28% | 2 months | 6 months |
| 2022 | Global Inflation & Rate Hikes | -20% | 5 months | 8 months |
| 2024 | Short-Term Volatility | -10% | 3 months | 4 months |
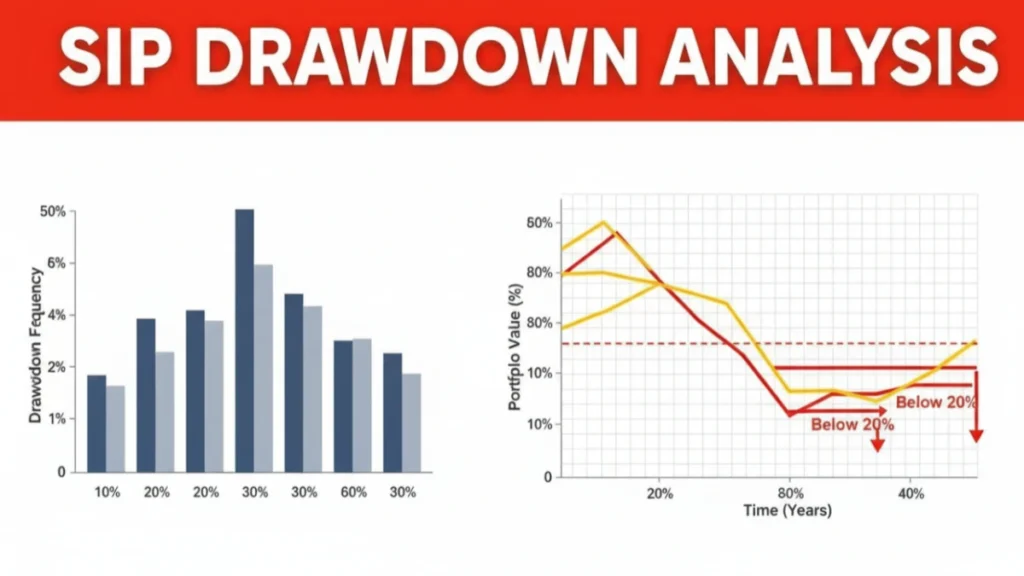
What Does Data Tell Us? (SIP Drawdown Frequency Analysis)
A study by Value Research and Morningstar (2025) found that even the best-performing SIP funds faced drawdowns of 15–25% at least once every 3 years.
Over a 10-year SIP, your portfolio will likely face:
- 3–4 moderate drawdowns (10–20%)
- 1 severe drawdown (25% or more)
So, a 20% dip is not failure — it’s part of the journey.
Expert Quote – Radhika Gupta (CEO, Edelweiss AMC):
“Volatility is not risk if your time horizon is long enough. SIPs are designed to thrive through drawdowns — not avoid them.”
Table 3: Fund-Specific Drawdown Data (10-Year SIP Returns)
| Mutual Fund | 10-Year CAGR | Max Drawdown | Recovery Period | Sharpe Ratio |
|---|---|---|---|---|
| Parag Parikh Flexi Cap Fund | 17.8% | -22% | 9 months | 1.25 |
| Axis Bluechip Fund | 15.2% | -20% | 10 months | 1.10 |
| Mirae Asset Large Cap Fund | 14.7% | -18% | 8 months | 1.08 |
| Quant ELSS Fund | 19.5% | -26% | 11 months | 1.35 |
| Kotak Equity Arbitrage Fund | 6.8% | -3% | 1 month | 0.45 |
Psychology of a 20% Drawdown
Here’s where most SIP investors go wrong — they feel the pain of loss more than the joy of gain.
Behavioral economists call this “loss aversion.”
A 20% dip feels emotionally equivalent to losing 40%, even if your portfolio eventually recovers.
That’s why discipline and perspective are key.
How to Handle It:
- Avoid looking at your SIP daily.
- Remember your goal (not your NAV).
- Increase SIP during dips — you buy more units at lower prices.
- Trust the compounding process.
Also Read: SIP Magic: ₹15,000 Monthly Turn Into ₹2 Cr by 2035
Table 4: SIP Drawdown vs Long-Term Wealth Creation
| Investment Tenure | SIP Amount (₹/month) | CAGR | Final Corpus | % Time in Drawdown (>15%) |
|---|---|---|---|---|
| 5 years | ₹10,000 | 12% | ₹8.2 lakh | 18% |
| 10 years | ₹10,000 | 13% | ₹22.8 lakh | 22% |
| 15 years | ₹10,000 | 14% | ₹45.5 lakh | 28% |
| 20 years | ₹10,000 | 14.5% | ₹76 lakh | 33% |
Futuristic Projection (2025–2035): SIP Volatility Outlook
Based on current valuations and projected economic cycles, here’s a realistic drawdown projection for the next decade (2025–2035):
| Year | Expected Drawdown Probability (>20%) | Key Triggers | Expected Recovery Period |
|---|---|---|---|
| 2026 | 15% | Global Rate Cuts, Overvaluation Correction | 6 months |
| 2028 | 25% | Commodity Shock, Inflation | 8–10 months |
| 2030 | 18% | Tech Bubble in India, Profit Booking | 7 months |
| 2032 | 22% | Global Recession Cycle | 9 months |
| 2035 | 10% | Stable Phase, India GDP Boom | 4 months |
Expert Insight – Nilesh Shah (MD, Kotak AMC):
“From 2025 to 2035, Indian SIP investors will face 2–3 drawdowns above 20%. But those who stay invested will see unprecedented wealth creation powered by India’s GDP and corporate earnings growth.”
Why SIPs Still Win Despite Drawdowns
A 20% dip doesn’t destroy wealth — quitting during it does.
Historically, investors who continued SIPs through bear phases earned 2× higher returns than those who paused or redeemed.
Here’s why SIPs outperform even with volatility:
- Rupee-cost averaging: You buy more when markets are low.
- Power of compounding: Recoveries multiply long-term wealth.
- Behavioral consistency: SIPs remove timing errors.
Warren Buffett once said:
“Be fearful when others are greedy and greedy when others are fearful.”
In SIP terms — buy more units during drawdowns.
Table 5: SIP Continuation vs Redemption Impact
| Behavior During 2020 Crash | 5-Year CAGR (2020–2025) | Final Corpus (₹10k/month SIP) |
|---|---|---|
| Continued SIP | 14.8% | ₹8.3 lakh |
| Paused SIP for 6 months | 10.9% | ₹7.1 lakh |
| Redeemed during crash | 0% | ₹5 lakh (no growth) |
The Golden Rule: Drawdown ≠ Risk
Many confuse drawdowns with risk — but they’re temporary setbacks, not permanent losses.
Risk is not knowing what you own.
Drawdowns are simply discounts on future returns.
Also Read: SIP Plans That Turn ₹10,000 Monthly Into ₹5 Crore
When you reframe dips as opportunities, your mindset changes from panic to purpose.
How to Build Drawdown-Resilient SIP Portfolios
To minimize pain during 20% declines, structure your SIP portfolio smartly:
1. Diversify Across Asset Classes
Mix of:
- 70% Equity (Flexi Cap, ELSS, Index)
- 20% Debt (Dynamic Bond, Arbitrage)
- 10% Gold ETF or REITs
2. Use Multi-Asset or Balanced Funds
These funds auto-balance equity & debt to smooth volatility.
Examples:
- ICICI Pru Multi-Asset Fund
- HDFC Balanced Advantage Fund
3. Stagger SIP Start Dates
Split SIP dates (1st, 10th, 20th) to reduce timing bias.
4. Review Annually — Don’t React Monthly
Performance varies in short-term but normalizes in long-term.
Table 6: Sample Drawdown-Resilient SIP Portfolio (2025 Allocation)
| Fund Category | Scheme Name | Allocation | Expected 10-Year CAGR | Drawdown Resilience |
|---|---|---|---|---|
| Flexi Cap | Parag Parikh Flexi Cap | 30% | 15–17% | High |
| Large Cap | Axis Bluechip Fund | 25% | 13–15% | High |
| Mid Cap | Kotak Emerging Equity | 15% | 16–18% | Medium |
| Debt | ICICI Pru Medium Term Bond | 20% | 8–9% | Very High |
| Gold ETF | Nippon India Gold | 10% | 7–8% | High |
Final Takeaway: Embrace Volatility, Don’t Fear It
By 2035, India’s SIP ecosystem could manage over ₹25 lakh crore in AUM.
Volatility will remain — but so will growth, innovation, and compounding.
The real wealth creators aren’t those who avoided 20% dips — but those who invested through them.
Motivational CTA:
Start or continue your SIP today.
Every 20% drawdown is a temporary setback on a permanent path to financial freedom.
Don’t measure progress by months — measure it by decades of discipline.
FAQs on SIP Drawdown Analysis
Q1. Can SIP portfolios really fall 20% or more?
Yes. Even top-performing SIPs experience 15–25% drawdowns during market corrections. It’s normal and temporary.
Q2. How often do such drawdowns occur?
On average, every 2–3 years. Over a 10-year SIP, expect 3–4 dips exceeding 15–20%.
Q3. Should I stop my SIP during market crashes?
No. Continuing SIPs during dips ensures you buy more units at lower NAVs, boosting long-term returns.
Q4. How long does it take for a SIP portfolio to recover after a 20% fall?
Typically 6–12 months, depending on market conditions and fund type.
Q5. Which SIP funds handle drawdowns better?
Diversified or multi-asset funds (like Parag Parikh Flexi Cap, HDFC Balanced Advantage, ICICI Multi-Asset) recover faster.