
As a curriculum architect, I view the Indian equity market not as a single monolith, but as a diverse ecosystem of opportunities requiring specific navigational tools. To build a resilient portfolio, an investor must move beyond surface-level definitions and understand the structural mechanics of company size, the “why” behind valuation premiums, and the legislative realities of the Indian market.
1. Foundations: Understanding the “Cap” in Capitalisation
In India, the Securities and Exchange Board of India (SEBI) provides a rigid, transparent framework to categorise companies based on their full market capitalisation. This ranking is updated semi-annually and serves as the primary filter for mutual fund managers.
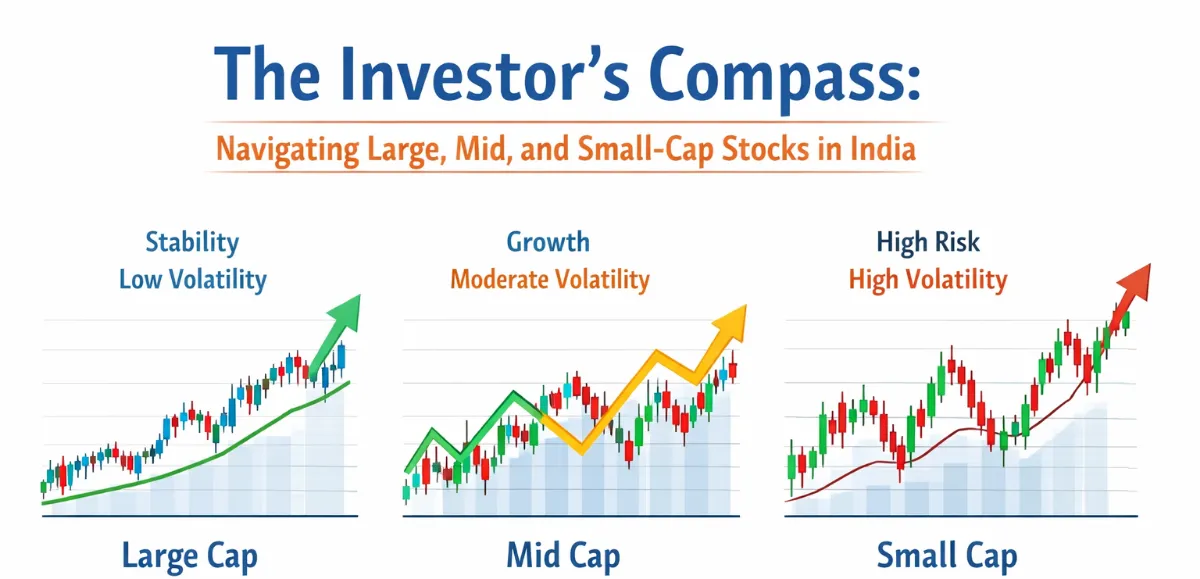
- Large-cap (1st–100th): The market’s “Blue-Chips.” These are the giants of industry with massive scale, established governance, and the highest liquidity.
- Mid-cap (101st–250th): The “Growth Engine.” These companies have moved past their infancy, possessing established business models but still offering high scalability.
- Small-cap (251st and below): The “Innovators.” This tier—including micro-cap companies—houses early-stage businesses. They offer the highest growth potential but are vulnerable to liquidity constraints and business failure.
To access these segments via mutual funds, an investor buys units at the Net Asset Value (NAV). For a student of the markets, it is vital to understand that NAV is merely the per-unit entry point into the fund’s underlying basket. Unlike a stock price, a low NAV does not mean a fund is “cheap,” nor does a high NAV mean it is “expensive.” It is simply the net value of all assets minus liabilities divided by the number of units.
The size of a company is the most reliable leading indicator of its volatility profile and its ability to withstand macroeconomic stress.
2. The Comparative Matrix: Stability vs. Agility
The character of a company changes as it moves through the capitalization ranks. Notably, the Indian market has seen a structural shift: Large-caps, which represented 72% of total listed market cap in 2020, have seen their share reduce to 60% by 2025, as Mid and Small-caps have captured a larger slice of the economic pie.
| Feature | Large-cap | Mid-cap | Small-cap |
| Market Character | Anchor: Core stability; provides safety during downturns. | Sweet Spot: Agile enough for growth; mature enough for resilience. | Innovator: High-conviction stories; susceptible to liquidity risk. |
| Growth Potential | Moderate/Steady; often tracks GDP+ growth. | High; the primary engine for “multi-bagger” transitions. | Very High; fastest growth but highest failure rate. |
| Volatility | Relatively Low; anchors the portfolio. | Moderate to High; prone to 15–20% swings. | Extreme; highly sensitive to news and sector trends. |
| Resilience | Highest; best balance sheets and market dominance. | High & Improving: Recovery from crashes has dropped from 1,900 days (2009) to <300 days. | Lower; can face prolonged “sideways” periods or total capital loss. |
The “So What?” for the Learner
While Large-caps provide the necessary ballast, they often lack the “agility” to double or triple in value quickly. Conversely, Mid-caps have evolved into a core market segment that increasingly behaves like a “growth-oriented core” rather than a purely speculative bet, evidenced by their vastly improved recovery speeds.
3. The Performance Engine: Risk and Return Realities
When we examine the 20-year performance engine of the Indian market, a clear “middle-market premium” emerges.
Historical data shows that mid-sized companies have outperformed both the largest giants and the riskiest micro-innovators:
- Nifty Midcap 150 TRI: 16.92%
- Nifty Smallcap 250 TRI: 15.12%
- Nifty 50 TRI (Large-cap): 14.04%
- Comparative Context: Even the Nifty Microcap 250 (16.88%) trailed the Midcap segment, proving the “Sweet Spot” thesis.
Risk and Current Valuations
While returns are high, the SEBI Riskometer classifies Mid and Small-cap equity funds as “Very High Risk.” This risk is not just theoretical; it stems from the high portfolio churning and concentration risk often seen in specialized funds (which may hold only 20–35 stocks).
Today, investors pay a premium for growth. Currently, Mid-caps trade at a median Price-to-Earnings (PE) of ~42x (a 10.7% premium to their 5-year average), while Large-caps trade at ~34x. This “valuation premium” warns investors that while growth is expected, they are entering the market at elevated levels.
4. Spotlight on Mid-caps: The “Mid to Mega” Sweet Spot
Mid-caps occupy the most dynamic space in the Indian portfolio for three distinct reasons:
- Business Maturity & Moats: Unlike Small-caps, these companies possess established RoE (Return on Equity) and management integrity. They are often leaders in niche sectors undergoing “value migration.”
- The 17% Transition Probability: Strategic wealth is built during the “Mid to Mega” shift. Historically, a mid-cap company has a 17% probability of growing into a top-100 Large-cap leader within a 5-year period.
- Dynamic Sector Rotation: The mid-cap universe reflects the changing face of India. In 2019, the segment was dominated by Financials and Consumer firms. By 2022, it shifted to Capital Goods and Chemicals. As of 2025, leadership has moved toward Electricals, Renewables, and Manufacturing.
The QGLP Framework
To identify future “Mega-caps,” we use the QGLP Framework:
- Quality: High RoE/RoCE, capital efficiency, and management integrity (the “Moat”).
- Growth: A target for sustained earnings growth of 20% CAGR or more.
- Longevity: Assessing the “runway” to ensure growth isn’t a “one-hit wonder.”
- Price: Practicing “Quality at a Reasonable Price” (QaRP) to ensure a margin of safety.
5. Investor Practicalities: Horizons and Trade-offs
A successful investment architecture requires matching the market segment to your timeline and cost-sensitivity.
| Market Segment | Recommended Horizon | Risk Tolerance |
| Large-cap | 3–5 Years | Moderate |
| Mid-cap | 7+ Years | High / Aggressive |
| Small-cap | 10+ Years | Very High |
Costs, Taxation, and Management
- Taxation Realities: Gains are not free. Short-Term Capital Gains (STCG) for units held <1 year are taxed at 20%. Long-Term Capital Gains (LTCG) for holdings >1 year are taxed at 12.5% on gains exceeding ₹1.25 lakh.
- Active vs. Passive:
- Active Management: Seek “Alpha” by deliberately deviating from the index. Concentrated portfolios (e.g., 20–35 stocks) often have a tracking error >90%. Expense ratios are higher (~0.74%).
- Passive Indexing: Simply buying the Nifty Midcap 150 Index. This is transparent and lower cost, with expense ratios as low as 0.26%.
- Exit Loads: Most funds charge a 1% load for redemptions within 365 days to discourage speculative “churning.”
6. Final Synthesis: Crafting Your Growth Narrative
To finalize your navigational strategy, internalize these three architectural principles:
I. Longevity Trumps Quantum
A massive earnings jump in a single year is a distraction. Sustainable wealth is created by businesses that can maintain high growth for a decade, allowing them to graduate into the next market cap tier.
II. Strategic Equilibrium
The reduction of the Large-cap share to 60% indicates that a modern Indian portfolio must be balanced. Use Large-caps as your anchor and Mid-caps as your growth engine.
III. Time as a Volatility Buffer
Because Mid-caps and Small-caps are “Very High Risk,” time is your only protection. A 7-to-10-year horizon allows short-term PE premiums to normalize and lets underlying earnings growth—not market sentiment—drive your returns.
Success in India’s equity landscape is achieved by mastering the collective rhythm of all three segments, ensuring your portfolio is built to endure corrections and scale with the economy.