Elcid Investment’s share price tells quite a story with one of the market’s most dramatic ranges. The stock moved from ₹3.53 to ₹332,399.94 during its 52-week period. The price dropped 4.35% to ₹143,413.84 on January 20, 2025.
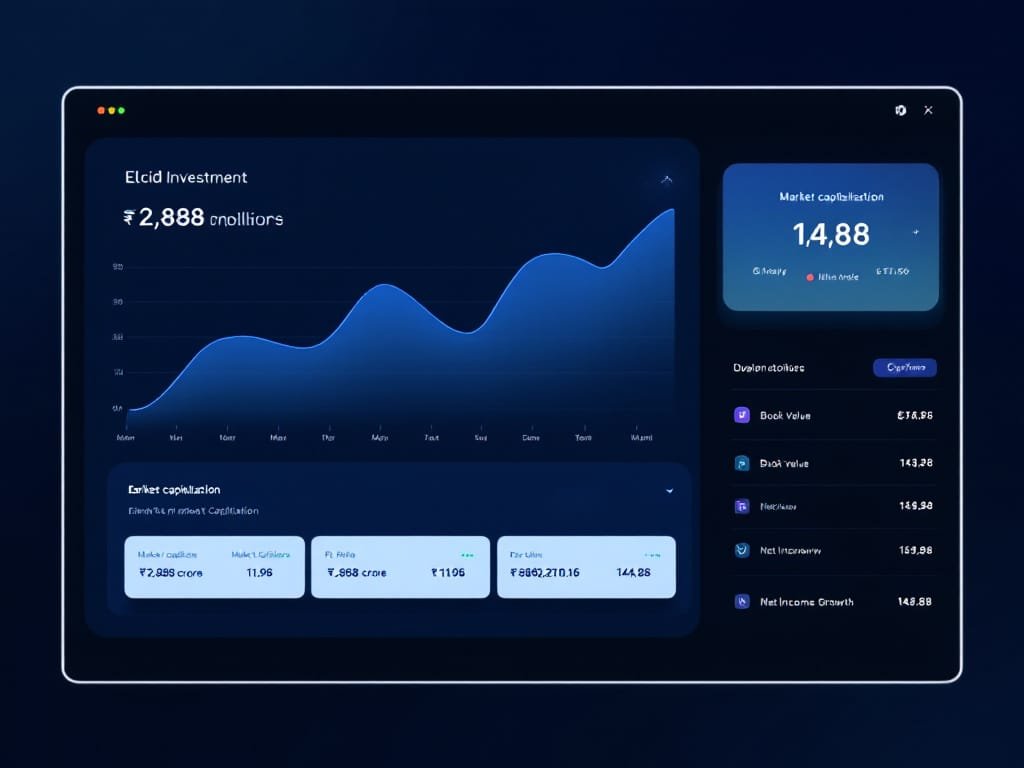
The stock fell 22.83% in the last month. However, Elcid Investment’s fundamentals remain strong. The company has stayed debt-free for five straight years. Their latest quarterly numbers show total income reached ₹56.65 crore, with an impressive 143.88% growth compared to last year. The company’s market value stands at ₹2,888.02 crore with a P/E ratio of 11.96. Let’s get into what this means for investors watching the stock’s movement.
Table of Contents
Understanding Elcid Investment’s Share Price Journey
Elcid Investments, a 44-year old specialized investment company, started its operations in 1981 with a focus on strategic portfolio management. The company kept a low profile until mid-2022, with minimal trading volumes and share prices that stayed around ₹2-3.
Historical price movements since inception
The stock traded at single-digit levels for several years. Daily trading sessions rarely saw volumes above a few hundred shares. A big change came when the stock price jumped from ₹2.10 in May 2022 to ₹17.00 by September 2021. The most dramatic price movement happened in October 2024. The share price shot up from ₹3.53 to ₹236,250 – this is a big deal as it means that there was a 66,92,535% increase in just one trading session.
Key milestones affecting share price
The stock’s journey has seen several vital developments:
- SEBI’s special price discovery session implementation in October 2024
- Achievement of ₹332,399.95 all-time high in November 2024
- Quarterly income growth of 143.88% year-over-year to ₹56.65 crore
- Application for Type-I NBFC registration in December 2024
Analysis of price trends over different timeframes
The share price shows distinct patterns in different periods. Recent trends point to a downward movement, with a 12.14% decline over one week and a 22.83% decrease over one month. Between December 2024 and January 2025, the price moved between ₹142,500 and ₹196,000, showing consistent volatility.
The stock’s recent performance stands out with a beta coefficient of 14.35K, showing high volatility compared to the broader market. Market participation has increased, with daily transactions now ranging from 200 to 400 shares.
The company’s quarterly results show a consolidated total income of ₹56.65 crore for the quarter ended September 2024. This represents a 68.16% drop from the previous quarter’s ₹177.91 crore. Notwithstanding that, the numbers show a 143.88% improvement compared to the same quarter last year.
Current Market Valuation Analysis
Elcid Investments‘ valuation metrics tell a fascinating story of a company that trades well below its book value. The stock’s current market position becomes clear when we look at its key financial ratios.
Price-to-earnings (P/E) ratio assessment
The P/E ratio currently sits at 11.96, which means the stock trades at about 12 times its earnings. This represents a huge 90% discount when you stack it up against its peer group’s median P/E of 117.66. The company shows remarkable strength with earnings per share (EPS) of ₹12,078.03, which backs up its market capitalization of ₹2,888.02 crore.
Book value comparison
Let’s look at some remarkable figures about the book value:
- Current book value per share: ₹685,220.16
- Book value growth rate (last 12 months): 6.90%
- 5-year average book value growth: 17.80%
- 10-year average book value growth: 74.60%
The price-to-book (P/B) ratio of 0.21 shows that the stock trades at just one-fifth of its book value. This gives value investors a great safety margin. The ratio has moved between a high of 0.48 and a low of 0.22 in the last 13 years.

Industry valuation measures
Elcid Investments stands out with these notable metrics:
- Return on Equity (ROE): 1.54%
- Return on Capital Employed (ROCE): 2.02%
- Operating Margin: 98.54%
- Net Profit Margin: 75.94%
The company carries zero debt-to-equity ratio, which shows strong financial discipline. The current ratio stands at an impressive 54,453.97, that shows exceptional liquidity management.
A detailed look at enterprise value metrics reveals:
- Enterprise Value/Revenue: 9.4x
- Enterprise Value/EBITDA: 9.5x
Multiple parameters suggest the stock’s current valuation looks attractive. The P/E ratio of 11.8x makes it a good match for the Capital Markets industry average of 23.2x. The company’s strong financial position shows up in its steady dividend yield of 0.02%. Though modest, this points to regular returns for shareholders.
Technical Analysis of Share Price Movements
Technical indicators show a complete picture of Elcid Investment‘s share price movements. Multiple signals suggest important market dynamics. The RSI(14) reading of 28.364 shows an oversold condition that creates potential reversal opportunities for investors.
Key support and resistance levels
The stock’s main support levels are at ₹147,280.50, ₹144,625.05, and ₹141,264.80. Resistance levels sit at ₹153,296.20, ₹156,656.45, and ₹159,311.90. Fibonacci pivot points reveal vital psychological barriers with R1 at ₹152,938.75 and S1 at ₹148,342.75.
Moving average trends
Bearish sentiment dominates across all timeframes in the moving average analysis. Simple and exponential moving averages both display consistent sell signals:
- MA5: ₹145,264.61 (Simple) and ₹145,323.34 (Exponential)
- MA20: ₹150,392.40 (Simple) and ₹150,092.65 (Exponential)
- MA200: ₹181,939.73 (Simple) and ₹179,407.56 (Exponential)
The stock trades below all but one of these SMAs, which suggests sustained downward pressure. The MACD reading of -4708.85 strengthens the bearish momentum as it stays below the signal line.
Volume analysis and price patterns
Average daily movements characterize the stock with substantial trading volumes. Recent sessions show a -1.9% price change with declining delivery volumes in the delivery percentage analysis.
The CCI reading of -121.1586 points to oversold conditions. The ATR of 2631.9263 shows high volatility, while Williams %R at -6.667 confirms overbought conditions in the short term.
A wide and falling trend channel contains the stock’s movement. Resistance appears at ₹162,664.66, with additional barriers at ₹190,346.96. The ADX reading of 67.586 reveals strong trend momentum that requires careful attention to price movements.
The Ultimate Oscillator reading of 36.85 and ROC at -7.301 prove the current bearish technical setup. The stock has dropped -54.63% since its pivot top point in November 2024.
52-Week High-Low Analysis
Elcid Investment’s share price tells an extraordinary story over the last 52 weeks. The stock touched both ends of the price spectrum between January 2024 and January 2025.
Breaking down the price range
The stock’s performance over 52 weeks shows dramatic price swings:
| Price Point | Value (₹) | Date |
|---|---|---|
| 52-Week High | 332,399.95 | November 2024 |
| Current Price | 144,401.00 | January 20, 2025 |
| 52-Week Low | 3.53 | June 2024 |
The stock managed to keep minimal trading activity at ₹3.53 until mid-2024. SEBI’s special call auction triggered a historic jump to ₹236,250.
Factors driving price extremes
SEBI’s new mechanism for investment companies sparked these extreme price movements. The stock jumped by 6,692,535% in just one trading session.
Several factors caused this price movement:
- A book value of ₹585,225 per share compared to a trading price of ₹3.5
- Limited free float that restricted price discovery
- SEBI’s implementation of special call auction framework
- Strong financial results with 149.62% year-over-year growth in net sales
Trading volume at price peaks and troughs
Trading patterns show interesting volume changes at different price levels. The stock saw little trading activity during the low-price period, with only 500 shares traded at ₹3.53 in June 2024. The volume picked up during the price surge when 241 shares changed hands at ₹236,250.
The stock now has an average daily volume of 205 shares. Recent trading sessions show steady volume patterns between ₹142,500 and ₹149,500. This suggests active price discovery in this range.
The price has dropped 56.86% from its 52-week high, but investors remain interested. January has historically brought positive returns, with gains in three out of four years. The highest gain was 33.75% in 2018.
Share Price Performance on BSE
Elcid Investments’ share price stands at ₹144,401.00 on the Bombay Stock Exchange. The stock shows unique trading patterns that need careful analysis.
Daily trading patterns
The stock trades between ₹142,500 (day’s low) and ₹149,500 (day’s high). Its Volume Weighted Average Price (VWAP) of ₹144,748.73 shows balanced trading activity throughout the session.
The market depth reveals this picture:
| Buy Side | Sell Side |
|---|---|
| 3 orders at ₹143,501 | 1 order at ₹144,500 |
| 1 order at ₹142,552 | 1 order at ₹145,000 |
| 1 order at ₹142,508 | 2 orders at ₹145,500 |
| 1 order at ₹142,500 | 1 order at ₹145,849 |
Institutional trading impact
The stock has a market capitalization of ₹2,888.02 crore and a free float market cap of ₹688.39 crore. A trading turnover of ₹2.97 crore with a two-week average of 104 shares suggests moderate institutional activity.
The price band stays at 5% with upper and lower circuits at ₹150,584.50 and ₹136,243.20 respectively. Group X category’s T+1 settlement cycle ensures quick trade execution.
Market sentiment indicators
Technical indicators suggest mixed market sentiment:
- Ultimate Oscillator reads 36.85, pointing to bearish momentum
- Stochastic RSI(14) at 93.316 shows overbought conditions
- Bull/Bear Power indicator at -6,998.0098 reflects current selling pressure
Sensex surged by 454.11 points (0.59%) to 77,073.44, yet Elcid Investments fell by 4.35%. The stock’s minimal correlation with market standards becomes evident through its price discovery mechanism and trading patterns.
Recent price movements follow heavy institutional interest, and all analysts recommend “sell”. The stock’s performance shows consistent decline: -13.03% (1 week), -24.90% (1 month), and -24.05% (3 months), which points to cautious market sentiment.
Future Price Target Projections
Market analysts have released diverse projections about Elcid Investment’s future share price. Their detailed financial analysis and market insights reveal an intriguing picture of the company’s valuation path ahead.
Analyst forecasts for 2025
The share price target for Elcid Investment in 2025 ranges between ₹290,490 and ₹620,485. This wide range reflects the stock’s recent volatility and changing market conditions. The lower estimate takes into account potential market risks and economic challenges while acknowledging the company’s strong fundamentals.
These projections draw support from several factors:
- Strong promoter holding of 75%
- Consistent dividend payments
- Zero debt status
- Strategic investment portfolio growth
Market experts expect sustained growth and project an intermediate target of ₹460,498 by mid-2025. Their forecast accounts for three major risk factors:
- Market volatility and economic downturns
- Portfolio concentration risk
- Limited liquidity and trading volume

Long-term price targets for 2030
The 2030 outlook shows ambitious targets between ₹1,090,500 and ₹2,378,955.
The extended outlook takes into account several challenges:
- Long-term market cycles affecting portfolio values
- Regulatory policy changes affecting investment strategies
- Industry dynamics and technological changes
Growth drivers and catalysts
The price projections rest on several key factors. The company owns a 1.28% stake in Asian Paints, valued at ₹3,616 crore, which makes up 80% of Elcid’s total market capitalization. This strategic holding sets the stage for sustained value appreciation.
The positive market sentiment stems from:
- Strong financial metrics with zero debt
- Consistent dividend payments with a yield of 708% in FY24
- Book value of ₹585,225 per share
- Trading at a price-to-book multiple of just 0.38
The company’s growth path benefits from its investment focus on high-growth sectors. Recent quarterly results show promising trends, with total income reaching ₹177.91 crore. A net profit margin of 76.41% demonstrates the company’s strong operational efficiency.
Risk Factors Affecting Share Price
A deep look at risk factors that affect Elcid Investment’s share price shows how market forces and operational challenges work together. Recent stock performance highlights several key issues investors need to think over.
Market risks and volatility
The share price shows high volatility. Daily price movements averaged 4.24% in the last week. We noticed major price swings that demonstrate:
| Volatility Metric | Value |
|---|---|
| Beta Coefficient | 14.35K |
| Daily Price Range | ₹9,965.30 |
| Monthly Decline | 26.86% |
Limited liquidity remains a big problem beyond price swings. The stock has only 328 public shareholders. This makes it hard for investors to buy or sell positions quickly.
Company-specific challenges
Portfolio concentration stands out as the company’s biggest risk. Elcid’s investments depend heavily on Asian Paints’ performance instead of staying diverse. Asian Paints’ recent report shows this clearly:
- Net profit fell 42.37% year-on-year to ₹694.64 crore
- Revenue from operations dropped 5.3%
- Elcid’s investment value decreased by ₹745 crore
Q2FY25 results reveal more operational challenges:
- Net profit dropped 68% from last quarter to ₹43.47 crore
- Revenue fell to ₹56.34 crore from ₹177.53 crore in Q1FY25
External economic factors
Broader economic challenges pose real risks to Elcid’s share price. The Indian stock market faces several issues:
- Foreign investors pulled out 909.3 billion INR in October
- Consumer markets show weakness that affects major companies
- Lower car sales and air travel suggest an economic slowdown
Goldman Sachs adjusted India’s GDP growth forecast to 6.7% for 2024-2025. These economic headwinds could hurt Elcid’s portfolio values and share price.
The stock remains sensitive to changes in regulatory policies and investment rules. Market analysts worry about:
- Long-term market cycles that affect portfolio values
- Traditional sectors facing disruption risks
- Technology changes that shape investment strategies
Investment Strategy Considerations
Elcid Investments needs careful evaluation of several factors before making strategic investment decisions. This stems from its unique market position and distinctive trading patterns. The company’s zero debt and steady profit growth of 26% CAGR over the last five years make it attractive to long-term investors.
Entry and exit points
Both technical indicators and fundamental metrics play a vital role in finding optimal entry and exit points. The stock’s current P/B ratio of 0.21 shows it trades well below its book value. This creates opportunities for value investors.
The following table outlines key price levels for strategic entry and exit:
| Strategy Type | Entry Point (₹) | Exit Point (₹) | Stop Loss (₹) |
|---|---|---|---|
| Value-based | 142,500 | 156,656 | 141,264 |
| Momentum | 144,625 | 159,311 | 136,243 |
| Swing Trading | 147,280 | 153,296 | 144,401 |
The stock’s reliable financial health helps it weather market fluctuations. Given the company’s total asset value of ₹14,660 crore, the current market price looks attractive.
Portfolio allocation recommendations
Elcid’s unique characteristics shape a sensible approach to portfolio allocation:
- Investment Profile Analysis:
- Core holdings in blue-chip stocks
- Strategic investments in a variety of sectors
- Focus on high-quality assets
- Strong emphasis on value preservation
The company’s conservative investment approach favors long-term value creation over speculative gains. The strong promoter holding of 75% adds stability that institutional investors value.
Key factors in portfolio allocation include:
- Market capitalization of ₹2,888 crore
- Zero debt structure
- Consistent dividend distribution
- Strategic stake in Asian Paints
Risk management approaches
Success with Elcid investments depends on solid risk management strategies. The company’s investment portfolio shows several traits that shape risk management:
- Operational Risk Controls:
- Regular portfolio review mechanisms
- Strategic advice from reputable managers
- Full risk assessment framework
- Market conditions monitoring
- Financial Risk Mitigation:
- Zero debt maintenance
- Strong liquidity position
- Diversified investment approach
- Focus on capital preservation
Investors should watch out for specific challenges:
- Limited trading volume affects position sizing
- Price volatility needs careful stop-loss placement
- Market risks impact portfolio valuations
- External economic factors influence returns
Regular consultations with portfolio managers help the corporation manage risks and keep investments within set parameters. The internal control system matches the company’s size and scope, adding another layer of risk management.
Smart position sizing depends on:
- Current market liquidity
- Individual risk tolerance
- Investment horizon
- Portfolio diversification needs
The company’s long-term investment strategies suggest building positions gradually. Staggered entry points work better than large single-position investments.
Conclusion
Elcid Investment’s stock price has soared from ₹3.53 to ₹332,399.94 in just one year. Recent market data reveals a 22.83% monthly decline, yet the company’s fundamentals remain strong. Smart investors should look beyond price swings and focus on the company’s zero-debt position, steady dividend track record, and remarkable 143.88% year-over-year income growth.
The company’s RSI(14) of 28.364 points to oversold conditions, while its P/B ratio of 0.21 presents an excellent chance for value creation. Market experts project share prices to reach between ₹290,490 and ₹620,485 by 2025. These projections draw support from the company’s strategic holdings and solid financial metrics.
Investors must evaluate what it all means, including the risks of limited trading volumes and concentrated portfolios. The stock’s unique features call for a balanced investment strategy that combines detailed research with careful position sizing. Success with Elcid Investment depends on patience, market timing, and risk management that matches individual goals.
Elcid Investment stands out in the Indian market with its substantial book value and strategic investments. Investors who want to succeed should watch technical indicators closely, keep positions appropriately sized, and stay updated on market conditions that affect the company’s portfolio results.
FAQs
Q1. What factors have contributed to Elcid Investment’s dramatic share price range? Elcid Investment’s share price has experienced significant volatility due to factors such as SEBI’s special price discovery session, strong financial performance, and its strategic stake in Asian Paints. The stock moved from ₹3.53 to a high of ₹332,399.94 within a 52-week period.
Q2. How does Elcid Investment’s current valuation compare to its book value? Elcid Investment currently trades at a significant discount to its book value. With a price-to-book (P/B) ratio of 0.21, the stock is trading at approximately one-fifth of its book value, potentially offering a margin of safety for value investors.
Q3. What are the key risks associated with investing in Elcid Investment? The main risks include high price volatility, limited trading volumes affecting liquidity, portfolio concentration (particularly in Asian Paints), and sensitivity to broader economic factors. The stock’s unique characteristics and limited free float also contribute to its risk profile.
Q4. What are analysts projecting for Elcid Investment’s future share price? Analysts project Elcid Investment’s share price to range between ₹290,490 and ₹620,485 by 2025, with long-term targets for 2030 ranging from ₹1,090,500 to ₹2,378,955. These projections consider the company’s strong fundamentals and strategic holdings.
Q5. How should investors approach Elcid Investment given its unique market position? Investors should consider a balanced approach, combining thorough research with disciplined position sizing. Given the stock’s limited liquidity, staggered entry points are advisable. It’s important to monitor technical indicators, maintain appropriate position sizes, and stay informed about market conditions affecting the company’s portfolio performance.










What i dont understood is in reality how youre now not really a lot more smartlyfavored than you might be now Youre very intelligent You understand therefore significantly in terms of this topic produced me personally believe it from a lot of numerous angles Its like women and men are not interested except it is one thing to accomplish with Woman gaga Your own stuffs outstanding Always care for it up