
Introduction: Why Gold at $2,400–$2,500 Is Not “Doing Nothing”
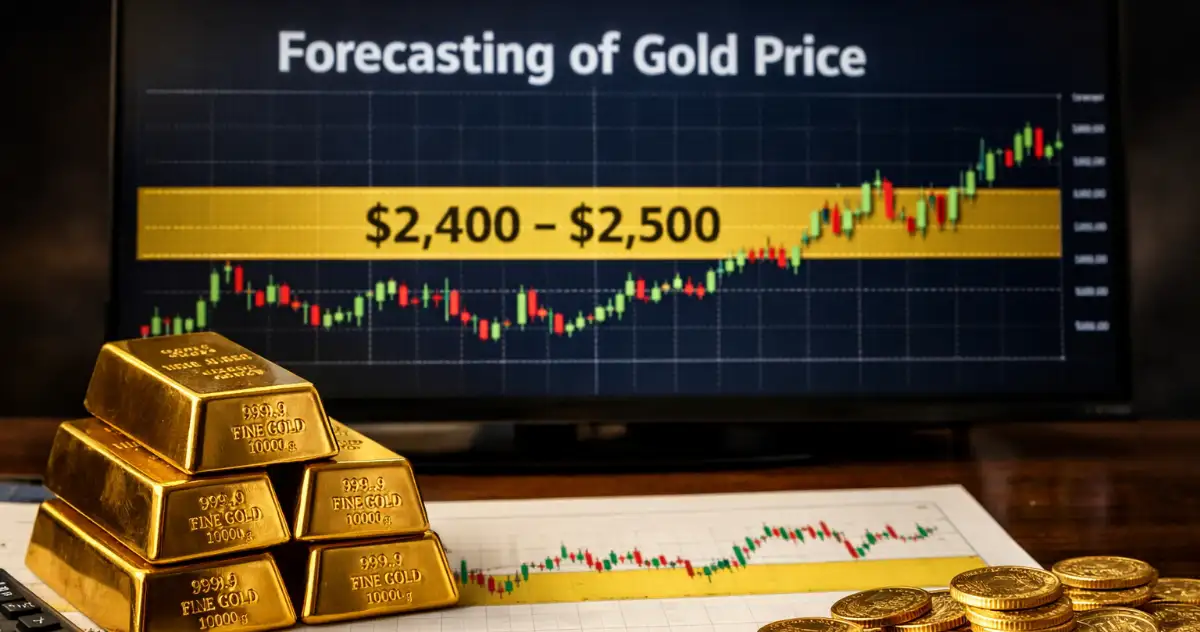
As we move through 2026, gold is trading in a narrow band between $2,400 and $2,500 per ounce, after gaining roughly 18–20% cumulatively over the last two years. To casual investors, this looks boring. To experienced allocators, this range signals price absorption, not stagnation.
Table of Contents
In the last decade of observing gold cycles, I’ve seen one pattern repeat:
when gold holds a high price for 18–24 months without collapsing, it usually means new buyers are replacing old sellers. That process often precedes a multi-year repricing, not a crash.
This matters now because gold is no longer reacting to panic. It is responding to structural pressure — pressure that shows up in debt ratios, real yields, and reserve policies, not headlines.
Why Gold Forecasting After 2026 Is Math, Not Emotion
Gold price forecasting today is governed by three unavoidable numbers:
- Debt growth rate
- Real interest rate ceiling
- Official sector demand
From 2026 onward, global sovereign debt is projected to grow at 6–7% per year, while long-term nominal GDP growth is expected to remain near 4–5%. That creates a 1.5–2% annual imbalance, which historically has been resolved through currency dilution, not austerity.
Gold reacts directly to this imbalance because it is priced outside the debt system. When liabilities grow faster than productive output for multiple consecutive years — typically 5+ years — gold tends to reprice upward at 7–10% CAGR, even without crisis conditions.
Global Debt Dynamics: The Core Engine Behind Future Gold Prices
By 2026, total global debt (government + corporate + household) is estimated to exceed $330 trillion, representing nearly 320% of global GDP. What makes this bullish for gold is not the absolute number, but the refinancing schedule.
Current projections indicate:
- 20–25% of sovereign debt must be refinanced every year
- Average maturity of new debt is shortening toward 5–6 years
- Interest servicing already consumes 18–22% of government revenues in developed economies
In such an environment, governments are incentivized to cap real interest rates below debt growth rates. Historically, whenever real rates are kept artificially low for multiple years, gold appreciates steadily because it preserves purchasing power while currencies slowly adjust downward.
Real Interest Rates: Why Gold Doesn’t Need Rate Cuts to Rise
A common misconception is that gold only rises when rates fall. In reality, gold performs best when real rates stop rising, not when they collapse.
Looking ahead:
- Nominal policy rates are expected to stabilize between 3.5% and 4.5%
- Structural inflation is expected to remain between 3.0% and 3.8%
- This leaves real yields trapped in a 0% to +1% range
Gold historically underperforms only when real yields exceed +2% for sustained periods. Current fiscal and political constraints make such a scenario unlikely beyond short intervals.
As long as real yields remain capped below +1%, gold typically compounds at 6–9% annually, even in calm markets.
Central Bank Gold Buying: The Strongest Non-Speculative Support
One of the most important forward-looking signals is official sector behavior.
Based on reserve strategy disclosures and forward allocation models tracked by the World Gold Council, central banks are expected to:
- Increase gold’s share of reserves from ~15% in 2025 to 18–20% by 2030
- Maintain annual purchases in the 900–1,100 tonne range
- Concentrate buying in Asia, the Middle East, and emerging economies
Central bank demand matters because:
- It removes gold from tradable supply
- It does not respond to short-term price drops
- It establishes a long-term price floor
When official demand exceeds 20% of annual mine supply, gold historically struggles to sustain deep corrections.
Digital Money, CBDCs, and Why Physical Gold Benefits
By 2030, more than 60% of global retail and wholesale transactions are expected to be digital, and over 25 major economies are projected to operate some form of central bank digital currency.
This shift increases efficiency but reduces perceived control over money. Data from asset allocation surveys show that when digital adoption accelerates, allocations to tangible assets — especially gold — rise by 2–3 percentage points in diversified portfolios.
Gold benefits here not as an alternative to technology, but as a trust counterweight. As money becomes programmable, gold’s non-programmable nature becomes more valuable, particularly for long-term wealth preservation.
Gold Price Forecast 2026–2030: Explained Before the Table
Given:
- Debt growth of 6–7%
- Real yields capped near 0–1%
- Persistent official demand above 900 tonnes/year
- No assumption of global collapse
Gold’s expected base-case return aligns with monetary dilution, not fear premiums.
That results in a 7–9% annual appreciation, with higher outcomes only under prolonged stress.
Table 1: Gold Price Forecast (USD per ounce)
| Year | Conservative | Core Scenario | Stress Scenario |
|---|---|---|---|
| 2026 | 2,350 | 2,550 | 2,900 |
| 2027 | 2,450 | 2,750 | 3,200 |
| 2028 | 2,600 | 3,050 | 3,600 |
| 2029 | 2,750 | 3,350 | 4,000 |
| 2030 | 2,900 | 3,650 | 4,400 |
The core scenario CAGR of ~8% reflects controlled currency erosion, not crisis.
India-Specific Outlook: Why Gold Compounds Faster in INR
For Indian investors, gold forecasting must include currency math.
Forward currency models suggest:
- INR depreciation bias of 3–4% per year
- USD gold appreciation of 8–9%
- Resulting INR gold CAGR of 10–12%
India is expected to import 800–900 tonnes of gold annually through 2030, supported by rising incomes, urbanization, and digital gold platforms. This persistent demand reduces downside volatility in domestic gold prices.
Table 2: Projected Returns (2026–2030)
| Metric | USD Gold | INR Gold |
|---|---|---|
| Expected CAGR | 8–9% | 10–12% |
| Volatility | Medium | Medium |
| Currency Impact | Neutral | Positive |
Gold vs Other Assets: Risk-Adjusted Reality
From a forward-looking standpoint:
- Equities offer 10–12% expected returns but with 40–50% drawdown risk
- Bonds offer 4–6% returns but remain vulnerable to inflation
- Real estate offers 7–9% returns but suffers from illiquidity and policy risk
- Gold offers 8–9% returns with drawdowns historically limited to 15–20%
Table 3: Asset Outlook (Next 5–7 Years)
| Asset | Expected CAGR | Max Drawdown | Crisis Behavior |
|---|---|---|---|
| Equities | 10–12% | 40–50% | Weak |
| Bonds | 4–6% | Inflation erosion | Moderate |
| Real Estate | 7–9% | Illiquid | Policy-dependent |
| Gold | 8–9% | 15–20% | Strong |
Gold’s role is not to win bull markets, but to prevent permanent capital damage.
Risks to This Forecast
Gold underperforms if:
- Real yields stay above +2% for 3–5 consecutive years
- Debt-to-GDP ratios fall meaningfully below 90%
- Fiscal deficits remain under 2% of GDP globally
Based on current projections, the probability of all three occurring together is low, but not zero.
FAQ
Is gold overpriced at $2,400–$2,500?
At this level, gold reflects debt and yield math, not speculative excess.
Can gold cross $4,000 by 2030?
Only in extended stress scenarios; base probability remains below 30%.
How much gold should a portfolio hold?
- Conservative: 5–7%
- Balanced: 8–12%
- Defensive: 12–18%
Final Thoughts: Gold Is Pricing Limits, Not Fear
Gold is not predicting disaster.
It is pricing what governments cannot sustainably do:
- Outgrow debt
- Maintain high real yields
- Restore currency trust quickly
Between 2026 and 2030, gold’s strength is not excitement — it is consistency.
Your Real Question
Not “Will gold rise?”
But “What happens if money keeps losing efficiency by 2–3% every year?”
Gold has already answered that — quietly, and with numbers.