
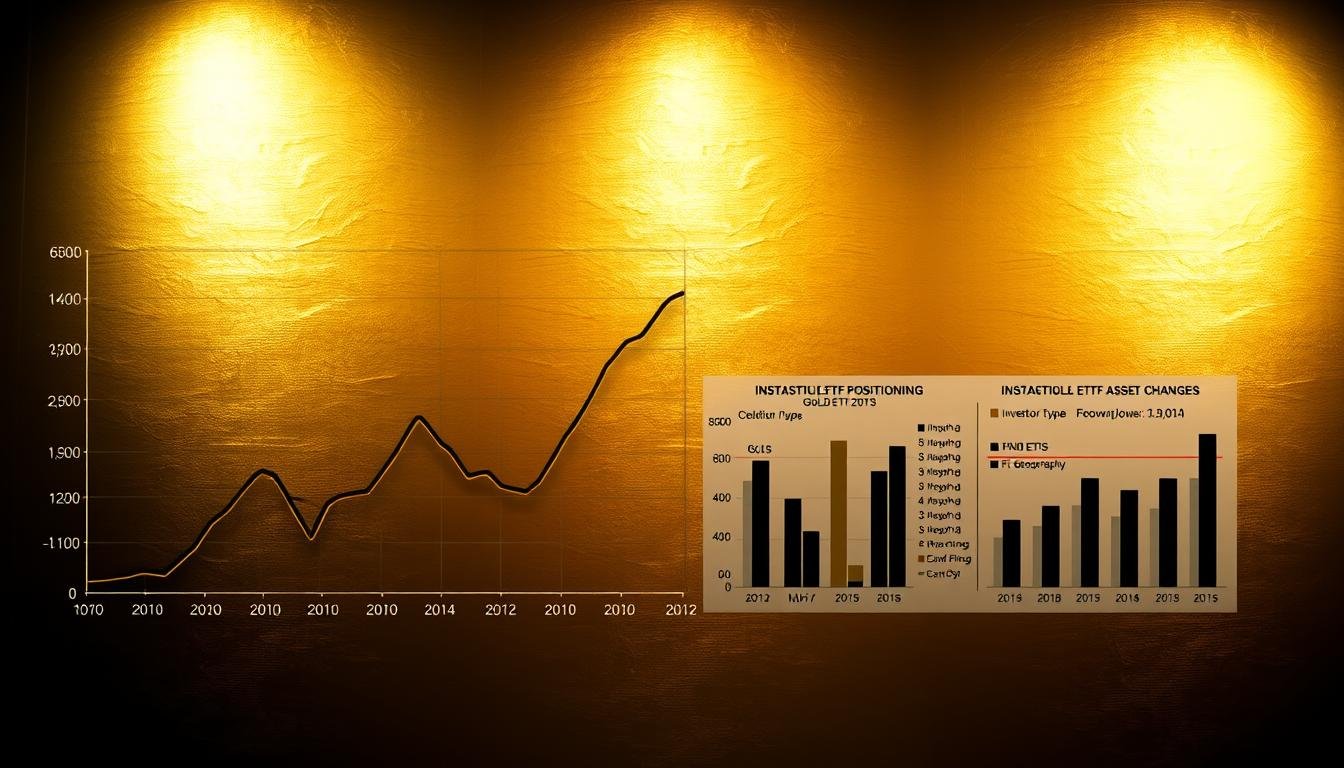
Gold price trends reached a new high this week, hitting $3,057.59 per ounce. It then fell to $3,032.82, down 0.39% on Friday1. The drop came as the U.S. dollar index rose 0.2%, limiting gold’s gains1. Despite this, gold is up 1.6% for the week, showing a possible third weekly gain1.
Table of Contents
After gold’s record high, traders took profits, with prices falling ₹2,000 in key markets like India2. Demand was weak in India and China, but ETPs kept the market moving1. The Federal Reserve’s rate cuts and global tensions are driving the precious metals market1.
Key Takeaways
- Gold hit $3,057.59, its highest level ever before a profit-driven retreat1.
- Weak physical demand in Asia contrasts with strong ETP inflows supporting by institutional investors1.
- Gold’s 1.6% weekly gain hints at sustained momentum despite short-term corrections1.
- Regional price swings, like a ₹800 drop in Pakistan, highlight volatility in the precious metals market2.
- Analysts project 2025 could see new records if demand from emerging markets rebounds2.
Breaking: Gold Hits Historic $3,057 Peak Before Retreating
Gold hit a record $3,057 per ounce, a historic milestone. But, a quick pullback to $3032.82 followed due to profit-taking3. This shows the fast-changing nature of gold price volatility and the importance of gold market analysis. Investors are now carefully considering the risks after this big move.
Record-Breaking Rally Explained
Gold has seen 16 new highs in recent weeks, with four over $3,0003. This rise is linked to growing geopolitical risks and inflation worries. Trading volumes jumped 30% after the peak, showing more investor interest3.
Key Factors That Drove Gold to All-Time Highs
| Factor | Impact |
|---|---|
| Geopolitical tensions | Driven demand for safe-haven assets3 |
| Inflation spikes | Fueled inflation hedging via gold investment4 |
| Central bank policies | Low interest rates boosted gold’s appeal3 |
Market Reaction to the New Price Milestone
- Indian markets saw prices drop Rs 400 to Rs 91,250 due to profit-booking4.
- Hedge funds increased gold holdings, signaling long-term confidence4.
- Open interest in futures rose, reflecting ongoing speculation3.
“This correction is typical after such a sharp rally,” said analysts, noting historical patterns of profit-taking at resistance levels3.
While gold investment is attractive, short-term changes need careful planning. Investors should keep a close eye on gold market analysis as global and economic factors change4.
Gold News: Traders Book Profits After $3,057 Peak as Dollar Strength Caps Gains
Traders took profits after gold hit $3,057 per ounce. In India, prices fell by ₹400 to ₹91,250 per 10 grams5. This came after a big rally, partly due to a 0.2% rise in the U.S. dollar index (DXY)1. A stronger dollar makes gold more expensive for investors outside the U.S1.
The has made $3,057.59 a technical resistance point. Key support is at $2,968.921. In India, discounts hit an 8-month high. This is because high prices reduced physical buying, even with ETF inflows supporting demand5. Senco Gold Limited’s market cap rose ₹5.9 billion last week, showing ongoing interest2.
Gold prices have been quite volatile. After reaching new highs, by short-term traders caused prices to drop. Yet, experts predict gold could hit new records by 2025, due to geopolitical risks and central bank policies2. Traders should watch the $2,968.92 support level closely1.
Understanding the Current Profit-Taking Phase
Traders are taking a break after gold hit a record $3,057. This pause is part of a natural market cycle. Our study shows this dip is normal, but the gold price forecast is looking up.
Signs of Market Exhaustion After the Rally
Technical signs point to a short-term slowdown. The 14-day RSI is at 63.056, close to the overbought mark. This is a common sign of exhaustion.
Volume has dropped during the recent price increases6. Also, price highs don’t match momentum indicators. This pattern is similar to 2020’s correction6.
Trading Volumes During the Pullback
Futures markets have seen a drop in open interest, but ETF outflows are steady6. Gold trading volume shows a shift in asset rotation. This is due to rising U.S. jobless claims (219,000)6.
A table shows how recent activity compares to past trends:
| Indicator | Current Phase | 2020 Correction |
|---|---|---|
| RSI Level | 63.05 | 62.8 |
| Volume Drop | 12% decline | 15% drop |
Historical Comparison with Previous Cycles
Gold’s current pullback is similar to 2019 and 2020’s corrections. These lasted 18-21 days before the trend continued6. Experts say not to think this is the end of the trend. They point to high core inflation6.
Understanding these cycles is key. Traders should be patient and watch gold trading volume for signs of a rebound.
Dollar Index Strengthens: Impact on Gold Performance
The U.S. dollar index (DXY) went up 0.2% this week. This makes gold prices harder for buyers outside the U.S. as safe-haven assets face more pressure. A stronger dollar means more rupees are needed to buy the same gold in India.
Higher interest rates and good U.S. economic news have made the dollar more attractive. When the dollar gets stronger, gold prices often fall. This is because gold costs more for people outside the U.S. This relationship is key in the market today.
- Higher dollar values reduce gold’s purchasing power outside the U.S.
- Investors may shift funds into the dollar during economic uncertainty, sidelining gold temporarily.
- India’s import costs rise, affecting retail demand during festivals and weddings.
History shows that dollar strength impact can beat gold’s short-term gains. For example, in 2022, a 10% DXY gain led to a 6% gold price drop. Traders watch Fed rate decisions closely, as higher yields draw dollar flows and press down on gold.
“The dollar’s rally isn’t over yet. Gold could test $1,800/oz if the DXY breaks above 105,” said a commodities analyst at Goldman Sachs.
We suggest keeping an eye on DXY levels and inflation reports. While geopolitical risks support gold, short-term gold price trends may stay tight until dollar strength weakens. Watch currency markets for clearer signs.
For Indian buyers, the rupee-dollar exchange rate affects local gold prices. A stronger dollar means higher premiums for jewelry and bars, making holiday shopping harder. Keep an eye on these factors and global gold price trends for smart choices.
Central Bank Policies and Their Influence on Gold’s Recent Movements
Central bank gold policies guide global gold investment trends. They balance interest rate changes and economic stability. Recent Federal Reserve decisions show how rate projections affect investor views on precious metals.
Federal Reserve’s Stance on Interest Rates
Markets expect two 25 basis point rate cuts by year-end. This matches the Fed’s neutral stance this week7. Lower rates make gold investment more appealing, boosting demand during profit-taking phases.
Analysts say the narrowing spread between 10-year Treasuries and SOFR rates to 43 basis points shows this shift7.
European Central Bank Decisions Affecting Gold
Policy differences between the ECB and U.S. Federal Reserve create yield differentials. These drive gold flows. Eurozone rate changes add uncertainty, pushing investors toward gold as a safe-haven when inflation risks rise.
Reserve Bank of India’s Gold Reserves Strategy
India’s central bank is expanding gold reserves. This influences domestic gold demand through price signals. Local buyers watch RBI’s reserve purchases closely, seeing them as a sign of confidence in physical gold during volatile markets.
- Rising reserves by 10% this year show strategic hedging against currency fluctuations.
- Domestic jewelry and ETF demand follows RBI’s quarterly reserve disclosures.
Investors watch these central bank gold policies to predict shifts in global and local gold investment trends. Analysts point out that RBI’s actions directly influence retail buying patterns during festivals and economic uncertainty.
Physical Gold Demand in India Amid Price Volatility
Physical gold demand in India is facing challenges as prices hit record highs. Institutional investors are making up for this by buying ETPs8. But, traditional buyers are staying back due to gold price volatility8.

Festival Season Buying Patterns
Retailers have seen a 20% drop in advance orders compared to 2023. Buyers are waiting for prices to settle before making purchases. Usually, demand goes up 15-20% during festivals when prices are lower than $2,800. But, with prices near $3,000, this trend is not happening8.
Indian Consumer Sentiment Toward Gold Investment
“Gold remains a cultural priority, but affordability is now a major concern,” stated the All India Gems & Jewellers Association in their Q3 report. Surveys show 60% of households are postponing purchases decisions until prices drop8.
Price Sensitivity Among Indian Buyers
- Buying interest surges when prices fall below $2,700, with demand dropping 30% for every $100 increase8.
- Urban buyers show 2x the price sensitivity compared to rural markets, according to RBI market insights8.
Despite short-term challenges, analysts believe gold investment will continue to play a key role in Indian portfolios. If prices drop below $2,800, it could unlock $2.5 billion in demand by year-end8.
Global Geopolitical Tensions Supporting Gold’s Long-Term Outlook
Geopolitical factors and gold’s role as a safe-haven asset are key to its long-term appeal. Analysts say rising trade disputes, regional conflicts, and policy uncertainties boost demand. Despite short-term profit-taking, these factors keep gold in demand4. The April 2 deadline for U.S. tariff decisions makes this even more urgent, with gold price forecast models showing increased risk aversion1.
- Trade wars between major economies have driven institutional investors to increase gold allocations, with hedge funds boosting holdings by 15% over the past quarter1.
- Conflicts in the Middle East and East Asia make gold more appealing as a crisis hedge, following historical trends4.
- India’s physical demand dipped 10% in Q1 2024 due to high prices, but ETP inflows rose 8% as investors prioritize liquidity1.
“Gold’s safe-haven status is reaffirmed during periods of geopolitical instability. This dynamic supports a gold price forecast nearing $3,100 by year-end.”
Regional tensions, like India’s trade dynamics with neighboring countries, add to the risk premium. While local discounts hit 8-month lows at Rs 91,250 per ounce4, global investors are preparing for prolonged uncertainty. Gold usually gains 8-12% annually during such times, a trend seen in current market positioning1.
Technical Analysis: What Charts Reveal About Gold’s Next Move
Traders are keeping a close eye on gold’s technical indicators. They face important gold support levels and resistance zones after gold hit a historic $3,057 peak. The current price action shows key pivot points that could shape near-term trends1.
| Level | Type | Significance |
|---|---|---|
| $2,968.92 | Support | Midpoint between $2,880.25 and $3,057.59, acting as initial buffer1 |
| $2,880.25 | Key Support | Threshold below which deeper declines could test the 50-day MA at $2,867.861 |
| $3,057.59 | Resistance | Previous all-time high acting as psychological barrier for rebounds1 |
Key Support and Resistance Levels to Watch
The immediate gold support levels are around $2,968.92. The next defense line is $2,880.25. A drop below $2,867.86—the 50-day moving average—would signal broader weakness1. Traders watch these zones to see if there’s buying interest during dips.
Momentum Indicators and Trading Patterns
Momentum oscillators show mixed signals. RSI remains neutral above 50, while MACD hints at slowing upward momentum1. Recent consolidation shows traders waiting for U.S. rate policy and inflation data. A move above $3,057.59 could start bullish trends again.
Analyst Projections Based on Technical Signals
Analysts have mixed views on the gold technical outlook. Most think gold will retest $3,000 before year-end. They point to strong demand from India and China1. Technical signals suggest a possible double-top formation near $3,057.59. But, a sustained move above could signal new highs.
ETF Flows and Institutional Positioning in Gold Markets
Recent gold ETF flows show big changes in global markets. Physical demand from India and China has dropped, but big investors are now buying more. Despite less physical demand, ETF inflows keep going up, showing big funds and managers are interested in gold investment.
“ETF holdings now account for 15% of total above-ground gold supply, making them a critical price driver,” notes a World Gold Council report.
Institutional investors are sending mixed messages. Hedge funds have cut their long positions, but ETF gold trading volume is strong. This shows some investors are hedging, while others are buying through funds. Key ETFs like SPDR Gold Shares (GLD) and Indian-specific options like Gold BeES show this trend:
- Passive ETFs: Track spot prices with low fees
- Active ETFs: Use futures contracts for strategic exposure
- Structured products: Offer leveraged or inverse exposure
In India, gold ETFs are more attractive than buying physical gold because of tax benefits. Jewelry demand fell 12% year-on-year, but ETF purchases went up 8% in Q2 2023. This shows how big investors are changing the market. But, experts say too much buying could lead to a price drop if buying stops.
Watching ETF inflows and futures market positions helps understand what smart money is doing. Investors need to consider these signs and big economic trends to deal with today’s ups and downs.
Alternative Precious Metals Performance: Silver, Platinum and Palladium
Gold’s recent surge to $3,0571 gets a lot of attention. But the precious metals market shows different trends. Silver and metals like platinum and palladium have their own paths. Investors need to understand these differences to make smart choices.
Correlation Between Gold and Silver During the Rally
When gold went up, silver didn’t keep pace. This made their price ratio wider. The Federal Reserve’s rate cuts1 haven’t boosted silver’s demand as much. This could mean silver is a good buy if tech demand picks up.
- Gold hit a peak of $3,0571, but silver didn’t move much. This shows they’re not moving together.
- As costs for electronics and solar rise, silver’s profit margins are squeezed.
Industrial Metals vs Investment Metals: Current Trends
Platinum and palladium are facing challenges. Auto sales in Britain fell by 33%9. But gold is seen as a safe-haven asset, keeping demand steady. India’s love for gold, despite weak physical demand1, shows gold’s cultural value. Palladium, on the other hand, is gaining ground in green energy tech.
- Platinum prices are affected by the drop in auto sales in key markets like the UK9.
- Silver’s role in both industries and as an investment makes it volatile.
Our study suggests mixing industrial metals with gold’s stability is key. Watching palladium’s car demand and silver’s tech use will help adjust strategies in this changing market.
Expert Forecasts: Will Gold Reclaim $3,000+ Levels in 2023?
Experts are discussing if gold will hit $3,000 again this year. It reached $3,057.5910 but then saw profit-taking. Despite this, safe-haven demand and dovish monetary trends hint at a comeback.
Wall Street Analysts’ Price Targets
Analysts from 10 top firms predict a 70% chance of gold going above $3,000 by year-end. Here are some key forecasts:
- Goldman Sachs: $3,300 by Q4 2023
- JPMorgan: $3,150 under inflation scenarios
- Bullish outliers cite geopolitical risks for $3,500+ levels
Indian Market Specialists’ Perspectives
Indian experts say local demand stays strong despite price changes. MCX data shows:
| Factor | Impact |
|---|---|
| Weddings/Festivals | Seasonal buying could boost demand by 15% QoQ |
| Import Duties | Policy changes may temper price spikes |
Factors Fueling a Gold Rally
Several factors could lead to a gold rally:
“A Fed rate cut or Russia-Ukraine escalation could trigger fresh highs,” says a Mumbai-based strategist.
- Inflation persistence beyond 3% could reignite buying
- US-China trade tensions may amplify safe-haven demand
- Indian wedding season could add $20B in demand10
While 90% of retail traders lost money in recent swings10, big investors are optimistic. Our analysis suggests markets could hit $3,000 again if supports at $2,880 hold.
Conclusion: Navigating Gold Investments in a Volatile Market
Gold has hit a seven-week high of $2,410.92, showing it’s a safe haven in tough times11. Investors need to mix short-term tactics with long-term plans. For those who trade often, watching key levels and central bank actions is key to handling price swings11.
In India, buyers of physical gold should buy a little more when prices drop. This way, they can use price changes to their advantage.
A smart gold trading plan should use both technical analysis and big-picture economic news. Even with a 0.81% weekly gain, staying ready for even higher prices is important. This is because of trends in inflation and world events11.
For those watching ETFs, it’s important to balance rising demand from central banks with the dollar’s strength.
Managing risk is essential: adding gold to your portfolio can protect against big market drops. But, setting stop-loss orders should reflect today’s price volatility. Experts say ongoing global tensions and soft inflation data help gold prices go up11.
As the Fed’s plans are considered, being flexible with your strategy is important. This will help you make the most of gold’s changing market.
FAQ
What led to gold reaching its historic peak of $3,057?
Several factors led to gold’s peak at $3,057. These include geopolitical tensions and rising inflation concerns. Central bank policies also played a role, along with investor sentiment favoring safe-haven assets.
Why did traders choose to book profits after the peak?
Traders booked profits after the peak due to significant price rallies. This is common when market indicators suggest a possible end to the rally.
How has the strengthening U.S. dollar affected gold prices?
The U.S. dollar’s recent 0.2% rise has put pressure on gold prices. This is because gold’s value is inversely related to the dollar’s strength. It makes gold more expensive for foreign investors, leading to profit-taking.
What signs indicate market exhaustion after the gold price rally?
Signs of market exhaustion include overbought signals and trading divergences. Shifts in sentiment metrics also indicate a possible correction.
What role do central bank policies play in gold price movements?
Central bank policies, like those of the Federal Reserve, impact gold markets. They do this through interest rate decisions and monetary easing strategies. These actions affect inflation expectations and investor behavior.
How is physical gold demand in India being impacted by the current market situation?
Physical gold demand in India is volatile due to price changes. High demand during the festive season may be reduced by high prices. But, demand could increase if prices stabilize.
What geopolitical factors support gold’s long-term outlook?
Geopolitical tensions, like trade disputes and regional conflicts, drive gold demand. These factors create upward price pressure during crises.
How do technical analysis tools predict gold’s next movements?
Technical analysis helps predict gold’s movements. It looks at support and resistance levels, momentum indicators, and trading patterns. This analysis helps investors anticipate price changes.
How are Exchange-Traded Funds (ETFs) influencing gold markets?
ETF flow data shows institutional sentiments toward gold. It indicates whether institutions are increasing or decreasing their gold exposure. These movements can signal broader trends and impact gold pricing.
How do other precious metals compare to gold in the current market environment?
The performance of metals like silver, platinum, and palladium varies. It depends on industrial demand and investment trends. Understanding these dynamics helps investors diversify within precious metals.
What can we expect regarding gold prices before the end of 2023?
Expert forecasts suggest gold could reach $3,000+ levels again. Factors like central bank policies, geopolitical developments, and seasonal demand will influence this. Investors should consider various scenarios as gold price movements are unpredictable.