
Introduction: Turning a Monthly SIP into ₹1 Crore — The Realistic Path
In 2025, building a ₹1 Crore corpus isn’t a dream—it’s a mathematical possibility. With Systematic Investment Plans (SIPs), even an ordinary salaried investor can create long-term wealth through disciplined investing and the power of compounding.
But the question remains: how much should you invest every month?
This article simplifies everything with ready-to-use SIP tables, 2025–2035 projections, expert-backed insights, and step-by-step strategies to help you map your journey to ₹1 Crore—regardless of whether your horizon is 5, 10, 15, or 20 years.
Understanding SIP and the Power of Compounding
A Systematic Investment Plan (SIP) allows investors to invest a fixed amount regularly (usually monthly) in mutual funds. SIPs take advantage of rupee-cost averaging and compound growth, helping investors accumulate significant wealth over time.
The magic lies in compounding—your returns start earning returns, leading to exponential growth. Even modest monthly investments can snowball into crores over decades when left untouched.
Table 1: How Compounding Works — A Simple Illustration
| Year | Monthly SIP (₹) | Annual Return (%) | Invested Amount (₹) | Final Value (₹) |
|---|---|---|---|---|
| 1 | 10,000 | 12% | 1,20,000 | 1,27,200 |
| 5 | 10,000 | 12% | 6,00,000 | 8,13,000 |
| 10 | 10,000 | 12% | 12,00,000 | 23,00,000 |
| 15 | 10,000 | 12% | 18,00,000 | 50,00,000 |
| 20 | 10,000 | 12% | 24,00,000 | 99,92,000 |
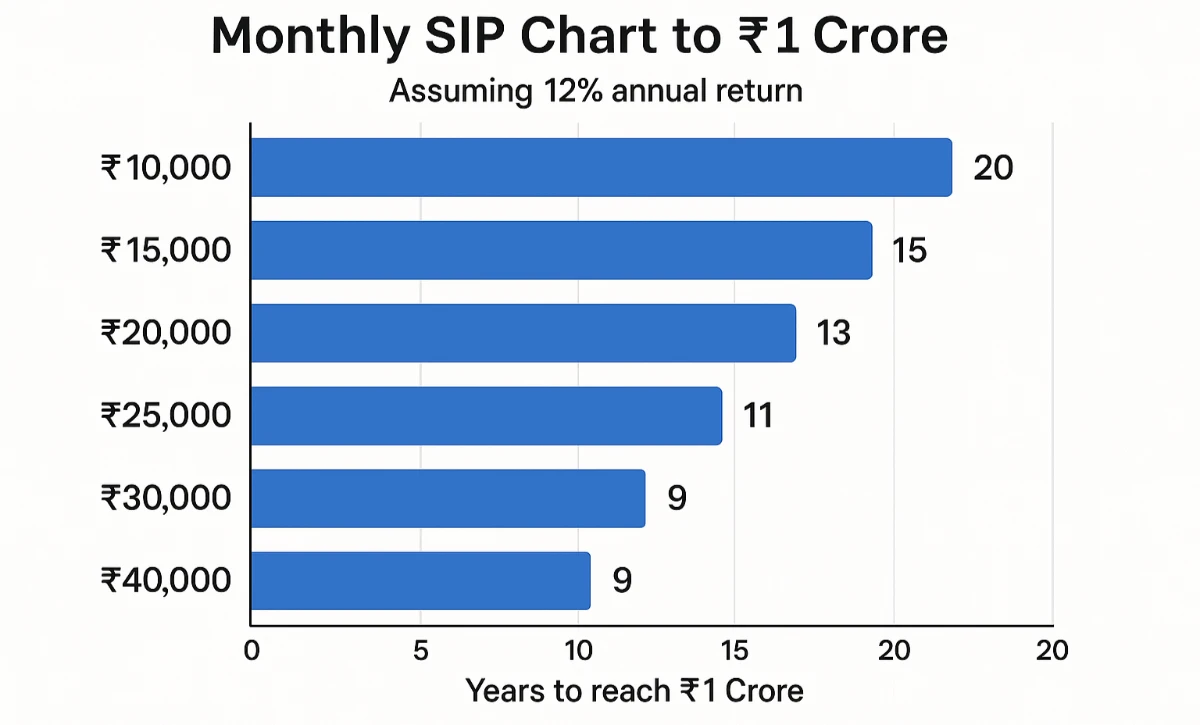
Insight: A 20-year SIP of ₹10,000/month at 12% annualized return grows close to ₹1 Crore—purely through consistency and compounding.
The Formula Behind the SIP Target Calculation
Financial planners use a simple Future Value of SIP formula to calculate the required monthly investment to reach a target corpus:
FV = P \times \frac{(1 + r)^n - 1}{r} \times (1 + r)
Where:
- FV = Target value (₹1 Crore)
- P = Monthly SIP amount
- r = Monthly rate of return (annual rate ÷ 12)
- n = Number of months (years × 12)
Rearranging gives you P = FV / [((1+r)^n – 1)/r × (1+r)], which is how our tables are derived.
Table 2: SIP Required to Reach ₹1 Crore (Different Tenures & Returns)
| Duration (Years) | 6% p.a. | 8% p.a. | 10% p.a. | 12% p.a. | 15% p.a. | 18% p.a. |
|---|---|---|---|---|---|---|
| 5 | 1,43,300 | 1,36,100 | 1,29,100 | 1,22,400 | 1,12,900 | 1,03,900 |
| 7 | 96,100 | 89,200 | 82,700 | 76,500 | 68,000 | 60,200 |
| 10 | 61,000 | 54,700 | 48,800 | 43,500 | 36,300 | 30,200 |
| 12 | 47,600 | 41,600 | 36,200 | 31,300 | 25,100 | 19,900 |
| 15 | 34,400 | 28,900 | 24,100 | 20,000 | 14,900 | 11,000 |
| 20 | 21,600 | 17,000 | 13,200 | 10,100 | 6,700 | 4,300 |
Observation:
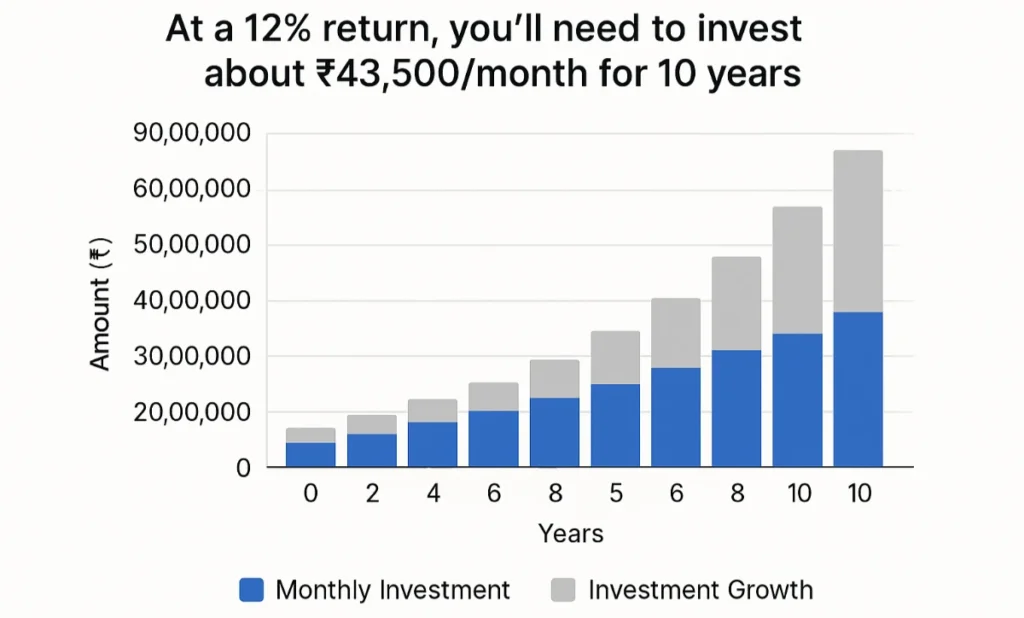
If your goal is ₹1 Crore in 10 years with a 12% return, you need to invest around ₹43,500 per month. Extend that to 15 years, and your monthly SIP drops to ₹20,000—highlighting how time reduces pressure.
Breaking Down Horizons: 5, 10, 15, 20 Years
1. Short-Term Horizon (5–7 Years)
Ideal for aggressive investors with higher risk tolerance. Expecting 12–15% returns is reasonable in equity-heavy portfolios.
However, shorter durations demand higher SIPs, leaving little room for market volatility.
2. Medium-Term Horizon (8–12 Years)
Balanced investors often target 10–12% returns with diversified equity and hybrid funds. SIPs in this range balance growth potential and stability.
3. Long-Term Horizon (15–20 Years)
This is where compounding truly shines. Investors with patience and discipline can achieve ₹1 Crore with a relatively small monthly SIP, even as low as ₹10,000–₹13,000 at 10–12% returns.
Table 3: ₹1 Crore Goal — Horizon vs Affordability (2025–2035 Projection)
| Investment Horizon | Approx. SIP Needed | Expected Return | Target Year | Realistic Fund Type |
|---|---|---|---|---|
| 5 Years | ₹1.22L | 12% | 2030 | Equity Aggressive |
| 10 Years | ₹43.5k | 12% | 2035 | Equity Diversified |
| 15 Years | ₹20k | 12% | 2040 | Equity Balanced |
| 20 Years | ₹10k | 12% | 2045 | Equity Index / Hybrid |
Why 2025–2035 Is a Golden Decade for SIP Investors
India’s economy is entering a period of high growth—backed by digital infrastructure, manufacturing expansion, and rising retail participation in markets.
Between 2025 and 2035, SIP inflows in mutual funds are expected to grow by 18–22% annually, according to AMFI and CRISIL reports.
NIFTY 50’s CAGR from 2010–2025 stands around 11.8%, while top-performing equity mutual funds delivered 13–17%. Assuming similar or improved returns, this decade may produce several ₹1 Crore-plus investors through disciplined SIPs.
Table 4: SIP Corpus Projection — ₹20,000/Month (2025–2035)
| Year | Return 8% | Return 10% | Return 12% | Return 15% |
|---|---|---|---|---|
| 5 | ₹14.7L | ₹15.5L | ₹16.2L | ₹17.1L |
| 7 | ₹22.3L | ₹23.9L | ₹26.0L | ₹28.6L |
| 10 | ₹37.5L | ₹41.0L | ₹46.4L | ₹56.3L |
| 12 | ₹49.8L | ₹56.2L | ₹64.5L | ₹81.7L |
| 15 | ₹70.5L | ₹82.0L | ₹1.03Cr | ₹1.45Cr |
Expert Insights: What Financial Planners Say
“SIP success isn’t about predicting markets—it’s about consistency. Over 15–20 years, even average-performing funds can turn small investments into multi-crore wealth if investors stay disciplined.”
— Ramesh Patel, CFA, Mumbai-based Wealth Advisor (2025)
“The coming decade will reward investors who blend equity growth with tactical rebalancing. SIPs in flexi-cap, ELSS, and large-cap funds offer ideal combinations of return and risk.”
— Priya Sinha, Certified Financial Planner, Delhi (2025)
The Role of Step-Up SIPs in Hitting ₹1 Crore Faster
A step-up SIP automatically increases your monthly investment every year (e.g., by 10%). It matches your income growth and accelerates compounding.
Also Read: SIP Magic: ₹15,000 Monthly Turn Into ₹2 Cr by 2035
Table 5: Step-Up SIP Example (Target ₹1 Crore @12%)
| Year | Step-Up % | Monthly SIP | Year-End Value (₹) |
|---|---|---|---|
| 1 | — | ₹20,000 | ₹2.4L |
| 2 | 10% | ₹22,000 | ₹5.0L |
| 3 | 10% | ₹24,200 | ₹7.9L |
| 5 | 10% | ₹29,000 | ₹14.9L |
| 10 | 10% | ₹46,600 | ₹41.2L |
| 12 | 10% | ₹56,000 | ₹1.0Cr |
Result: A 10% annual step-up allows you to start small but still reach ₹1 Crore in 12 years.
Risk, Return, and Asset Allocation
Investing through SIPs doesn’t eliminate risk—it manages it.
Your asset allocation (equity, debt, gold, or hybrid) defines your volatility and growth potential.
A well-diversified approach cushions your portfolio against market downturns.
Table 6: Suggested Asset Mix by Investment Horizon
| Horizon | Equity | Debt | Gold/Other | Ideal Return Range |
|---|---|---|---|---|
| 5 Years | 80% | 15% | 5% | 10–12% |
| 10 Years | 70% | 25% | 5% | 11–13% |
| 15 Years | 75% | 20% | 5% | 12–15% |
| 20 Years | 80% | 15% | 5% | 13–16% |
Inflation & Taxation: The Hidden Adjusters
While SIPs compound, inflation erodes purchasing power. A ₹1 Crore corpus in 2035 may equal only ₹60–70 lakhs in today’s value if inflation averages 5%.
To offset this, increase SIPs yearly and review portfolio returns after adjusting for inflation.
Tax-wise:
- Equity funds: 10% LTCG tax beyond ₹1 lakh.
- Debt funds: Indexed capital gains (if held >3 years).
Regular portfolio reviews ensure your post-tax real return stays aligned with your goal.
Table 7: Adjusted Value of ₹1 Crore (Inflation @5%)
| Target Year | Nominal Value | Real Value (Today’s ₹) |
|---|---|---|
| 2030 | ₹1 Cr | ₹78L |
| 2035 | ₹1 Cr | ₹61L |
| 2040 | ₹1 Cr | ₹48L |
Insight: ₹1 Crore in 2035 ≈ ₹61 Lakhs today. Factor this into your SIP goal.
Also Read: SIP Plans of ₹2000 Monthly: Building a ₹1 Crore+ Fortune
Top Fund Categories for 2025–2035
Experts recommend focusing on equity mutual funds with consistent 5–10-year records, reasonable expense ratios, and strong fund management.
Recommended SIP Categories:
- Large Cap Index Funds (Low-cost, 10–12% CAGR)
- Flexi Cap Funds (Adaptive allocation, 11–14% CAGR)
- ELSS Funds (Tax-saving, 12–15% CAGR)
- Mid & Small Cap Funds (High-growth, 14–18% CAGR)
- Balanced Advantage Funds (Dynamic mix, 9–11% CAGR)
Table 8: Example of Funds Matching SIP Goals
| Category | Average 10-Yr Return | Risk Level | Use Case |
|---|---|---|---|
| Large Cap | 11% | Low | Core portfolio |
| Flexi Cap | 12% | Moderate | Growth engine |
| ELSS | 13% | Moderate | Tax saving |
| Mid Cap | 14% | High | Wealth booster |
| Balanced Advantage | 10% | Low | Stability anchor |
Common Mistakes to Avoid
- Stopping SIPs During Market Falls — Volatility is your friend; keep investing.
- Over-diversification — 3–4 well-chosen funds are enough.
- Ignoring Inflation — Always calculate real (inflation-adjusted) returns.
- No Step-Up — Without annual increases, your corpus grows slower.
- Mixing Goals — Keep separate SIPs for short-term and long-term objectives.
Realistic 2025–2035 SIP Scenarios
Let’s visualize potential outcomes for a disciplined SIP investor starting in 2025:
Scenario 1: ₹15,000/month SIP (Balanced Equity Funds)
- 10 Years @ 12% = ₹34.7 Lakhs
- 15 Years @ 12% = ₹78 Lakhs
- 18 Years @ 12% = ₹1.12 Crore
Scenario 2: ₹25,000/month SIP (Aggressive Equity Focus)
- 10 Years @ 14% = ₹58.5 Lakhs
- 15 Years @ 14% = ₹1.47 Crore
- 20 Years @ 14% = ₹2.94 Crore
Insight: ₹25,000/month from 2025–2035 in high-performing funds can make you a multi-crore investor before 2040.
Table 9: Projected SIP Wealth (2025–2035 Range)
| SIP (₹/Month) | 10Y @10% | 12Y @12% | 15Y @14% |
|---|---|---|---|
| ₹10,000 | ₹19L | ₹30L | ₹59L |
| ₹15,000 | ₹28L | ₹45L | ₹88L |
| ₹20,000 | ₹38L | ₹60L | ₹1.17Cr |
| ₹25,000 | ₹48L | ₹75L | ₹1.47Cr |
Frequently Asked Questions (FAQ)
Q1. How much SIP is needed for ₹1 Crore in 10 years?
At a 12% return, you’ll need to invest about ₹43,500/month for 10 years.
Q2. Can ₹10,000 per month SIP make ₹1 Crore?
Yes, but you’ll need around 20 years assuming 12% returns.
Q3. Which SIP funds are best for long-term (2025–2035)?
Large Cap Index Funds, Flexi Cap Funds, and ELSS are suitable for consistent long-term compounding.
Q4. Should I increase SIP every year?
Yes. A 10% annual step-up significantly reduces your time to ₹1 Crore.
Q5. Is SIP risk-free?
No. SIPs reduce volatility through cost averaging but still carry market risk. Long-term discipline mitigates it.
Conclusion: Start Small, Stay Consistent, Think Long-Term
Building ₹1 Crore through SIPs is less about the amount and more about discipline. Whether you start with ₹5,000 or ₹50,000, time and consistency decide your wealth.
Markets will fluctuate, but the mathematics of compounding never fails the patient investor.
“Compounding is the eighth wonder of the world. He who understands it, earns it; he who doesn’t, pays it.” — *Albert