
Investing in stocks can feel like stepping into a whirlwind of numbers, charts, and jargon. If you’ve ever wondered how investors decide whether a stock is a golden opportunity or an overpriced trap, you’re in the right place. One of the most essential tools in an investor’s toolkit is the P/E ratio, or Price-to-Earnings ratio. But what exactly is it, and how can it help you make smarter investment decisions?
Introduction: Why the P/E Ratio Matters
The stock market is a vast playground where fortunes are made and lost. Amid all the noise, the P/E ratio stands out as a beacon of clarity. Short for Price-to-Earnings ratio, it’s a financial metric that compares a company’s stock price to its earnings per share (EPS). In essence, it shows how much investors are willing to pay for each dollar of profit a company generates.
Why does this matter? Because it’s a quick way to gauge whether a stock is overvalued (too expensive), undervalued (a potential steal), or priced just right. Think of it as your investing compass—it won’t tell you everything, but it’ll point you in the right direction.
Over the next few sections, we’ll explore how to calculate the P/E ratio, what the numbers mean, and how you can use it to spot opportunities. We’ll also look at its limitations and throw in some examples to bring it all to life. Ready to become a P/E ratio expert? Let’s get started!
Table of Contents
How to Calculate the P/E Ratio: A Step-by-Step Guide
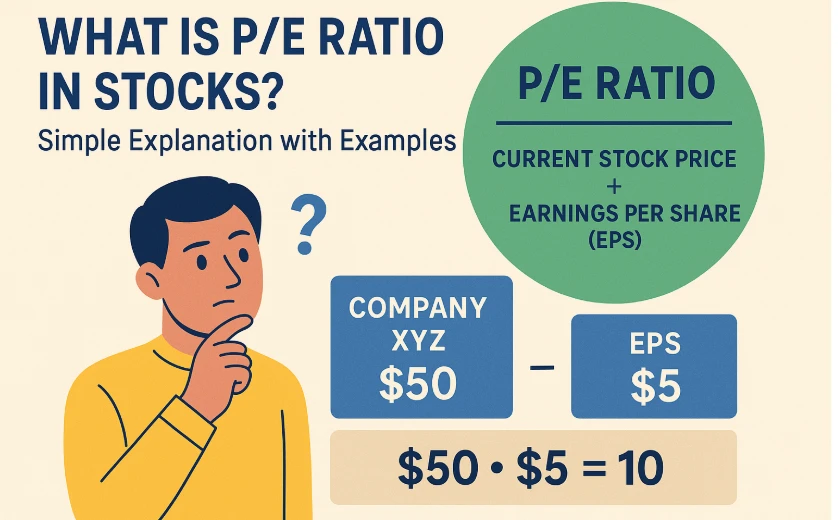
Calculating the P/E ratio is as easy as brewing your morning coffee—once you know the steps. All you need are two numbers: the current stock price and the earnings per share (EPS). Here’s the formula:
P/E Ratio = Current Stock Price ÷ Earnings Per Share (EPS)
Let’s break it down with a simple example.
Imagine you’re eyeing Company XYZ. Its stock is trading at $50 per share, and its EPS is $5. Plug those numbers into the formula:
P/E Ratio = $50 ÷ $5 = 10
This means you’re paying $10 for every $1 of Company XYZ’s earnings. Simple, right?
Where Do You Find These Numbers?
- Stock Price: Check financial websites like Yahoo Finance, Google Finance, or your brokerage account. It’s the current market price of one share.
- EPS: This is trickier but still accessible. Companies report their earnings quarterly or annually, and EPS is calculated by dividing the total profit (net income) by the number of outstanding shares. You can find it in a company’s financial statements or on stock market platforms.
Trailing vs. Forward P/E: A Quick Twist
There’s a small catch—EPS can come in two flavors:
- Trailing EPS: Based on the past 12 months of actual earnings. It’s solid and reliable since it’s based on real data.
- Forward EPS: Based on forecasted earnings for the next 12 months. It’s speculative but useful for companies expected to grow.
For example, if Company XYZ’s forward EPS is projected at $6 next year, its forward P/E would be:
Forward P/E = $50 ÷ $6 ≈ 8.33
A lower forward P/E might hint that the stock could become more attractive if those projections hold true. Now that you’ve got the math down, let’s figure out what these numbers are telling you.
Interpreting the P/E Ratio: What Does It Mean?
So, you’ve calculated a P/E ratio of 10. Is that good? Bad? Time to buy or sell? The answer isn’t cut-and-dried—it depends on context. Here’s how to decode it.
The Basics
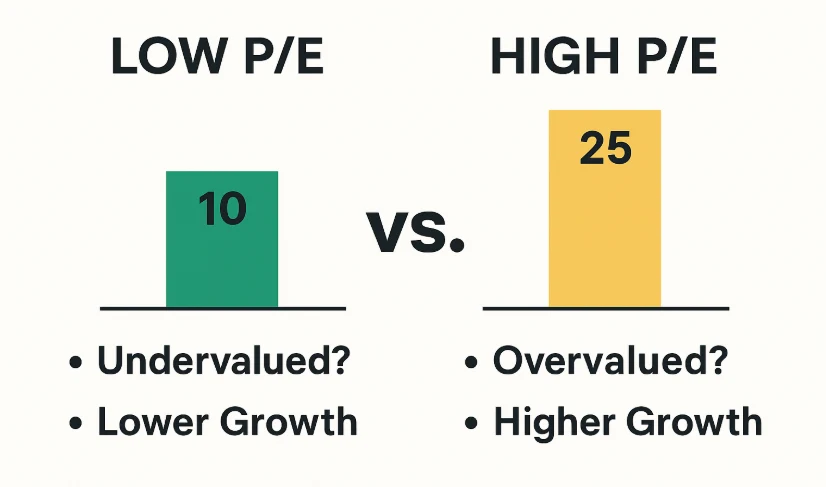
- Low P/E (e.g., 5-15): Suggests the stock might be undervalued. Investors aren’t paying much for each dollar of earnings, which could mean a bargain—or a company in trouble.
- High P/E (e.g., 20-30+): Indicates the stock might be overvalued. Investors are shelling out big bucks for each dollar of earnings, often because they expect future growth.
- Negative P/E: Happens when a company loses money (negative earnings). It’s not useful for valuation in this case.
Industry Matters
Here’s the kicker: a “good” P/E ratio varies by industry. Tech companies often sport high P/E ratios because investors bet on rapid growth, while utility companies have lower P/E ratios due to their steady, predictable earnings.
Check out these average P/E ratios by sector (hypothetical for illustration):
- Technology: 25
- Healthcare: 20
- Retail: 18
- Energy: 15
- Utilities: 12
If a tech stock has a P/E of 20, it’s below the industry average of 25—possibly a deal. But a utility stock with a P/E of 15 might be pricey compared to its sector’s 12.
A Time Perspective
Another way to think about P/E is as the number of years it’d take for the company to earn back your investment, assuming earnings stay constant. A P/E of 10? That’s 10 years. A P/E of 30? 30 years. Of course, earnings rarely stay static, so this is a rough guide.
Growth Changes Everything
A high P/E isn’t always a red flag. If a company’s growing like wildfire, investors might happily pay more. For example:
- Company A: P/E of 10, 2% annual growth
- Company B: P/E of 25, 15% annual growth
Company B’s higher P/E could be justified by its growth potential. This is where the PEG ratio (P/E divided by growth rate) comes in handy—we’ll touch on that later.
The takeaway? Don’t judge a P/E in isolation. Compare it to peers, historical averages, and growth prospects to get the full picture.
Types of P/E Ratios: Know Your Options
The P/E ratio isn’t a one-size-fits-all metric. There are a few variations, each with its own flavor. Here’s a rundown:
- Trailing P/E
- Uses earnings from the past 12 months.
- Pros: Based on real, reported data.
- Cons: Doesn’t predict the future.
- Forward P/E
- Uses forecasted earnings for the next 12 months.
- Pros: Forward-looking, great for growth stocks.
- Cons: Relies on estimates, which can be off.
- Shiller P/E (CAPE Ratio)
- Averages inflation-adjusted earnings over 10 years.
- Pros: Smooths out economic cycles, ideal for market-wide analysis.
- Cons: Less useful for individual stocks.
- Sector P/E
- Average P/E for an industry or sector.
- Use it to benchmark a company against its peers.
- Market P/E
- Average P/E for the entire market (e.g., S&P 500).
- Helps gauge if stocks are broadly overvalued or undervalued.
Choosing the right type depends on your goal. Want a snapshot of today? Go with trailing P/E. Betting on tomorrow? Forward P/E’s your pick. Analyzing the big picture? Shiller P/E has you covered.
Using the P/E Ratio in Investment Decisions: Your Playbook
Now that you understand the P/E ratio, how do you use it to pick winning stocks? Here’s a practical playbook:
1. Compare to Industry Peers
Look at similar companies. If the average P/E in the retail sector is 18 and your target stock is at 12, it might be undervalued—worth a deeper dive.
2. Check Historical Trends
Has the company’s P/E been higher or lower in the past? A current P/E below its 5-year average could signal a buying opportunity.
3. Benchmark Against the Market
The S&P 500’s average P/E hovers around 20-25. A stock with a P/E of 15 might stand out—unless it’s in a low-P/E industry.
4. Watch the Trend
Is the P/E rising or falling? A climbing P/E might mean growing confidence, while a dropping P/E could hint at trouble.
5. Pair with Growth (PEG Ratio)
Divide the P/E by the annual growth rate. A PEG below 1 suggests undervaluation; above 1 might mean overvaluation.
6. Factor in the Economy
High P/E ratios are more common in bull markets; low P/Es might dominate during downturns.
Case Study: Tech Titans
Let’s compare two hypothetical tech stocks:
- TechStar: P/E of 18, 5% growth
- GrowFast: P/E of 35, 20% growth
PEG for TechStar: 18 ÷ 5 = 3.6 (overvalued)
PEG for GrowFast: 35 ÷ 20 = 1.75 (closer to fair value)
Despite the higher P/E, GrowFast might be the smarter pick due to its growth.
“The P/E ratio is a starting point, not the finish line. Dig deeper into the company’s story.” – Adapted from investing wisdom
Limitations of the P/E Ratio: What It Can’t Tell You
The P/E ratio is powerful, but it’s not perfect. Here are its blind spots:
- No Growth Insight: A high P/E could mean overvaluation—or a growth superstar.
- Useless for Losses: Negative earnings? P/E won’t help.
- Accounting Tricks: Earnings can be manipulated, skewing the ratio.
- Ignores Debt: A low P/E with high debt isn’t a steal.
- Industry Blindness: Comparing across sectors can mislead.
- Cyclical Swings: Earnings in volatile industries distort P/E.
To fill these gaps, pair P/E with metrics like P/B ratio, debt-to-equity, or cash flow. It’s one piece of the puzzle—not the whole picture.
Real-World Examples: P/E in Action
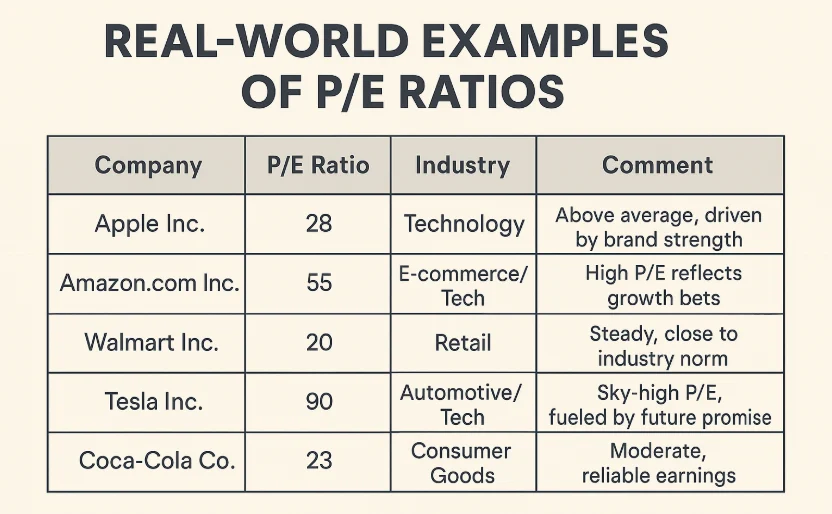
Let’s see how P/E ratios play out with some big names (data hypothetical for 2023):
| Company | P/E Ratio | Industry | Comment |
|---|---|---|---|
| Apple Inc. | 28 | Technology | Above average, driven by brand strength |
| Amazon.com Inc. | 55 | E-commerce/Tech | High P/E reflects growth bets |
| Walmart Inc. | 20 | Retail | Steady, close to industry norm |
| Tesla Inc. | 90 | Automotive/Tech | Sky-high P/E, fueled by future promise |
| Coca-Cola Co. | 23 | Consumer Goods | Moderate, reliable earnings |
Tesla’s towering P/E shows investors banking on its innovation, while Coca-Cola’s modest P/E reflects its stable, predictable business. Context is everything!
FAQs: Your P/E Questions Answered
- What’s a “good” P/E ratio?
- It varies by industry. Compare to peers and historical norms.
- Can P/E be negative?
- Yes, if earnings are negative. It’s not useful then.
- How’s P/E different from PEG?
- PEG factors in growth rate for a fuller view.
- How often should I check P/E?
- Quarterly, alongside earnings reports, is plenty.
- Is a low P/E always better?
- Not if the company’s struggling—check the why.
- Does P/E work for startups?
- Not really. Use revenue multiples or other metrics instead.
Conclusion: Your P/E Power-Up
The P/E ratio is your window into a stock’s value, revealing whether it’s a diamond in the rough or a shiny overpriced bauble. From calculating it with ease to interpreting it with nuance, you now have the tools to wield it wisely. Just remember: it’s a guide, not gospel. Combine it with other metrics, industry insight, and your own goals to build a winning portfolio.
Next time you’re scanning stocks, whip out the P/E ratio and see what it tells you. Happy investing!