Introduction: Why Investors Obsess Over the S&P 500 YTD
The stock market moves daily, sometimes wildly, and investors often need a simple way to measure its direction. That’s where the S&P 500 Year-to-Date (YTD) return comes in. It’s like the market’s annual report card, showing how the U.S. economy’s biggest companies have performed since January 1.
But while this number gets quoted on CNBC, Bloomberg, and financial headlines, here’s the reality: the S&P 500 YTD can both inform and mislead investors. To invest wisely, you need to know what it shows, what it hides, and where it’s heading.
1. What Does S&P 500 YTD Mean in 2025?
- YTD = “Year-to-Date” → from January 1 to today.
- S&P 500 YTD return = how much the index has gained or lost in that period.
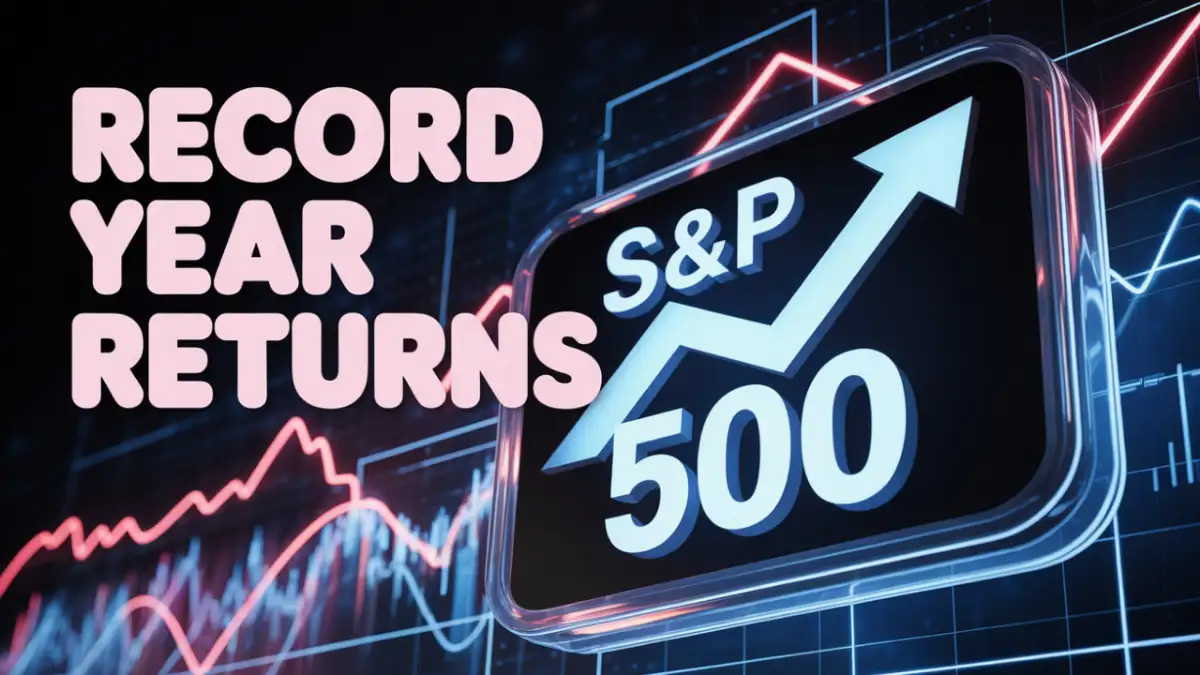
- As of September 30, 2025, the S&P 500’s total return is +14.83%, a strong rally compared to other assets.
Why it matters:
- Acts as a benchmark for your portfolio.
- Serves as a market health check.
- Guides investment decisions (rebalance or hold).
Table 1: S&P 500 YTD vs Other Assets (as of Sept 30, 2025)
| Asset Class | YTD 2025 Return | Notes |
|---|---|---|
| S&P 500 (Total Return) | +14.83% | Strong rally, broad gains |
| Nasdaq 100 | +17.2% | AI-led tech boom |
| Dow Jones | +9.4% | Industrial-heavy |
| Gold | +6.1% | Safe-haven, lagging stocks |
| 10-Year U.S. Treasury Bonds | +3.7% | Fed rate cuts support |
| Bitcoin | +42% | High volatility, speculative |
2. History Lessons: The S&P 500’s Wild Ride
The S&P 500 has been around since 1957, representing ~80% of U.S. stock market value. Historically, it has averaged 10.3% annual returns. But that average hides extreme booms and busts.
- Biggest highs:
- 1933: +46% after Depression collapse
- 1999: +41.6% during dot-com bubble
- 2021: +28.7% post-COVID rally
- Worst lows:
- 2008: -56.8% in Global Financial Crisis
- 2002: -23.4% after dot-com bust
- 2022: -18.1% during inflation + Fed hikes
Table 2: Historic S&P 500 Returns
| Year | Return % | Key Event |
|---|---|---|
| 1933 | +46% | Depression rebound |
| 1999 | +41.6% | Dot-com mania |
| 2008 | -56.8% | Financial crisis |
| 2013 | +32.4% | Fed QE recovery |
| 2021 | +28.7% | Stimulus boom |
| 2022 | -18.1% | Inflation + Fed hikes |
| 2025 (YTD) | +14.83% | Fed easing + AI optimism |
Lesson: The S&P 500 is a long-term wealth builder, but it’s a short-term rollercoaster.
3. S&P 500 in 2025: A Strong but Uneven Rally
The S&P 500 is up +14.83% YTD (Sept 30, 2025). A positive year so far, but not all sectors are equal.
- Winners: Energy (+21.3%), Tech (+19.7%), Communication Services (+17.9%)
- Laggards: Healthcare (+6.9%), Utilities (+5.6%)
Table 3: 2025 Sector Returns (YTD)
| Sector | YTD Return | Growth Driver |
|---|---|---|
| Energy | +21.3% | Strong oil demand |
| Tech | +19.7% | AI-driven profits |
| Communication Services | +17.9% | Streaming & ads growth |
| Consumer Discretionary | +15.5% | Resilient U.S. spending |
| Industrials | +13.4% | Defense + infrastructure |
| Financials | +11.2% | Bank earnings strong |
| Real Estate | +9.8% | Rate cuts support |
| Healthcare | +6.9% | Policy pressures |
| Utilities | +5.6% | Weak vs growth stocks |
Investors are increasingly “buying the dip”, suggesting confidence that U.S. equities remain resilient.
4. Why the S&P 500 YTD Can Mislead Investors
The headline number (+14.83%) is exciting, but here’s why it can be misleading:
- Magnificent 7 Effect: Apple, Microsoft, Nvidia, Amazon, Alphabet, Meta, and Tesla are driving most of the gains.
- Skewed Picture: The other 493 stocks are much weaker.
- Not a Full Portfolio: The S&P 500 excludes bonds, small caps, and international stocks.
Also Releted: Investing in S&P 500: Futures & Top Picks
Table 4: Magnificent 7 vs Rest of Market (2025 YTD)
| Group | YTD Return | Index Weight | Influence |
|---|---|---|---|
| Magnificent 7 | +27.5% | ~29% | Driving most gains |
| Other 493 Stocks | +9.8% | ~71% | Lagging behind |
| Equal-Weight S&P 500 | +11.2% | N/A | Better reflection of breadth |
Investor Warning: A strong S&P 500 YTD doesn’t always mean the broader economy or your portfolio is equally strong.
5. What’s Next? The S&P 500 Outlook (2025–2035)
Analysts are cautiously optimistic. Most predict the index will end 2025 between 6,800–7,200 points.
Bullish drivers:
- Fed rate cuts boosting growth
- AI adoption fueling earnings
- Strong U.S. consumer demand
- $7T in cash sitting in money market funds
Risks:
- High valuations (21x forward P/E vs 16x historical)
- Trade wars, elections, geopolitical uncertainty
- Recession signals from inverted yield curve
Table 5: S&P 500 Forecast Scenarios
| Year | Optimistic | Base Case | Bearish |
|---|---|---|---|
| 2025 YE | 7,200 (+20%) | 6,800 (+14%) | 6,000 (+2%) |
| 2026 | 8,000 | 7,200 | 5,800 |
| 2030 | 12,000–13,000 | 10,000 | 7,000 |
| 2035 | 15,000+ | 12,500 | 9,000 |
Long-term investors could see 70–120% gains by 2030–2035 if history repeats.
6. Expert Tips: How to Use the S&P 500 YTD Wisely
- Use it as a benchmark, not a verdict.
- Diversify across sectors, international markets, and bonds.
- Don’t chase YTD winners blindly—they may correct sharply.
- Think long-term—the S&P 500 rewards patience, not panic.
Table 6: Portfolio Example (Balanced vs S&P 500)
| Portfolio Type | YTD 2025 Return | Notes |
|---|---|---|
| 100% S&P 500 Index Fund | +14.83% | High volatility, full exposure |
| Balanced 60/40 (Stocks/Bonds) | +10.2% | Lower risk |
| Global Diversified (U.S. + Intl + Bonds + Gold) | +11.5% | Smoother performance |
7. FAQs on S&P 500 YTD
Q1: Is S&P 500 YTD the best way to judge the stock market?
It’s a good indicator, but incomplete—small caps and global equities matter too.
Q2: Can the S&P 500 reach 10,000 by 2030?
Yes, if annual growth averages 7–10%. Many forecasts see 10,000–12,000 by 2030.
Q3: Should I invest now even after a +15% rally?
Yes, if long-term. Time in the market beats timing the market.
Q4: Are S&P 500 index funds safe?
Safer than picking single stocks, but still exposed to U.S. equity risks.
Conclusion: Your 2025 Market Report Card
- Current YTD: S&P 500 up +14.83% → a strong year.
- Reality check: A few mega-cap tech stocks mask broader weakness.
- Future outlook: 6,800–7,200 by year-end, 12,000+ possible by 2030.
- Best strategy: Stay diversified, focus long-term, and don’t chase headlines.
The S&P 500 YTD is a useful snapshot, but it’s not the full story. For real investing success, focus on your portfolio, risk tolerance, and financial goals.










Leave a Reply