
Introduction
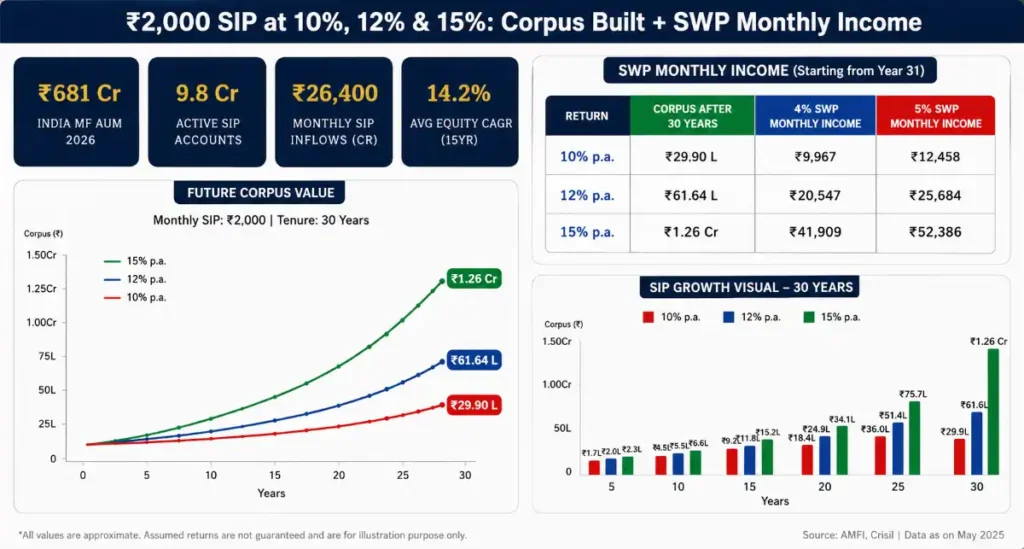
A ₹2,000 monthly SIP may seem modest, but compounding at 10%–15% annual returns transforms it into a life-changing corpus over 15–30 years. In 2026, with India’s mutual fund AUM crossing ₹68 lakh crore, systematic investing has never been more accessible or rewarding.
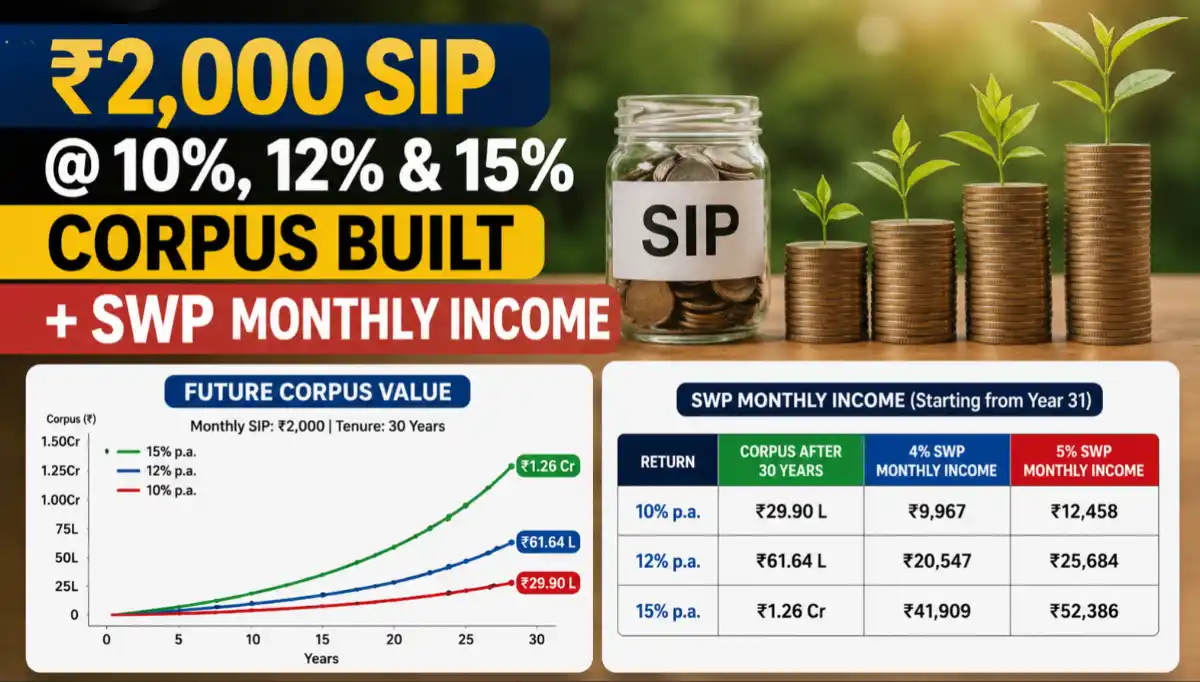
This guide breaks down exactly how much corpus ₹2,000/month builds at 10%, 12%, and 15% CAGR across 10, 15, 20, and 30-year horizons — and how a Systematic Withdrawal Plan (SWP) converts that corpus into reliable monthly income.
Market Overview — Why SIP Works in 2026
India’s equity markets have delivered a 15-year Nifty 50 CAGR of ~14.2% (as of May 2026). Flexicap and midcap funds have outperformed at 16–18% over the same period, making 12–15% return assumptions realistic for disciplined investors.
The RBI’s accommodative stance in H1 2026, declining inflation (CPI at 4.3%), and strong GDP growth projection of 6.8% for FY2027 create a favorable environment for equity SIPs. Dollar-cost averaging through SIPs protects against short-term volatility while maximizing long-run participation.
Table 1 — India Market Macro Context (2026–2027)
| Indicator | 2026 Value | 2027 Forecast | Impact on SIP |
|---|---|---|---|
| GDP Growth Rate | 6.5% | 6.8% | Positive |
| CPI Inflation | 4.3% | 4.0% | Favorable |
| Nifty 50 P/E Ratio | 21.4x | 22–24x | Moderate |
| Mutual Fund AUM | ₹68L Cr | ₹78L Cr | Growing |
| SIP Monthly Flow | ₹26,400 Cr | ₹31,000 Cr | Rising |
Key Data Insights — Corpus at ₹2,000/Month
The table below shows the accumulated corpus from a ₹2,000 monthly SIP at three different return rates across four time horizons. Total invested capital at 30 years = ₹7.2 lakh only.
Table 2 — ₹2,000/Month SIP Corpus Growth (Invested vs Earned)
| Tenure | Amount Invested | @ 10% CAGR | @ 12% CAGR | @ 15% CAGR |
|---|---|---|---|---|
| 10 Years | ₹2.40 L | ₹4.14 L | ₹4.65 L | ₹5.57 L |
| 15 Years | ₹3.60 L | ₹8.37 L | ₹10.08 L | ₹13.38 L |
| 20 Years | ₹4.80 L | ₹15.19 L | ₹19.98 L | ₹29.63 L |
| 30 Years | ₹7.20 L | ₹45.59 L | ₹70.07 L | ₹1.40 Cr |
At 15% CAGR over 30 years, a ₹2,000 SIP generates ₹1.40 crore — a 19.4x return on total invested capital of just ₹7.2 lakh. The power of compounding becomes exponential beyond the 20-year mark, where returns accelerate sharply.
₹1.40 CroreCorpus from ₹2,000/month SIP at 15% CAGR over 30 years — on a total investment of just ₹7.2 lakh. Wealth multiplier: 19.4x
Investment Strategy — SIP to SWP Blueprint
The smartest two-phase strategy: Accumulate via SIP → Withdraw via SWP. Once your corpus is built, a Systematic Withdrawal Plan lets you draw a fixed monthly amount while the remaining corpus continues to grow — essentially replicating a pension.
A safe SWP withdrawal rate is 6–8% annually of corpus. At 8%, your corpus still grows if the underlying fund delivers 12%+ returns. This creates a self-sustaining income engine.
Table 3 — Monthly SWP Income from Corpus (at 6% & 8% Annual Withdrawal)
| Corpus (after 30 yrs) | Return Rate | SWP @ 6%/yr | SWP @ 8%/yr | Monthly Income |
|---|---|---|---|---|
| ₹45.59 L | 10% CAGR | ₹2.74 L/yr | ₹3.65 L/yr | ₹22,800–₹30,400 |
| ₹70.07 L | 12% CAGR | ₹4.20 L/yr | ₹5.61 L/yr | ₹35,000–₹46,700 |
| ₹1.40 Cr | 15% CAGR | ₹8.40 L/yr | ₹11.20 L/yr | ₹70,000–₹93,300 |
At 15% CAGR with 8% SWP, your ₹2,000/month investment over 30 years pays you back ₹93,000/month — roughly 46x your original SIP amount. This is the real magic of long-term compounding in equity mutual funds.
Growth Forecast — Projections to 2032
India’s equity market is expected to deliver Nifty 500 CAGR of 13–16% through 2032, driven by domestic consumption, manufacturing (PLI schemes), digital economy growth, and financialization of savings. Midcap/smallcap indices are forecast to outperform large caps by 2–3% annually.
Table 4 — Projected SIP Corpus Growth: ₹2,000/Month (2026–2032)
| Year | Months Invested | @ 10% | @ 12% | @ 15% |
|---|---|---|---|---|
| 2026 (Start) | 1 | ₹2,000 | ₹2,000 | ₹2,000 |
| 2027 | 12 | ₹25,200 | ₹25,600 | ₹26,200 |
| 2028 | 24 | ₹52,800 | ₹54,500 | ₹57,200 |
| 2029 | 36 | ₹83,300 | ₹86,900 | ₹93,800 |
| 2030 | 48 | ₹1.17 L | ₹1.23 L | ₹1.36 L |
| 2031 | 60 | ₹1.55 L | ₹1.65 L | ₹1.87 L |
| 2032 | 72 | ₹1.97 L | ₹2.12 L | ₹2.44 L |
By 2032, just 6 years of ₹2,000 SIP at 15% builds a corpus of ₹2.44 lakh — compared to ₹1.44 lakh invested. Every ₹1 invested becomes ₹1.70 in just 6 years at 15%, demonstrating the compounding curve even in the short term.
Risk Analysis — Comparing Return Scenarios
No investment is without risk. 10% CAGR reflects conservative large-cap or hybrid funds; 12% CAGR suits diversified equity funds; 15% CAGR aligns with aggressive midcap/flexicap strategies. Risk and reward scale together — here’s an honest comparison.
Table 5 — Risk vs Reward Comparison for SIP Returns
| Return Scenario | Fund Category | Risk Level | Volatility (Std Dev) | Best For |
|---|---|---|---|---|
| 10% CAGR | Large Cap / Balanced | Low–Medium | 12–15% | Conservative investors, 40+ |
| 12% CAGR | Flexicap / Multi-cap | Medium | 16–19% | Moderate risk, 30–45 age |
| 15% CAGR | Midcap / Small-cap | Medium–High | 22–28% | Aggressive growth, 25–35 age |
Table 6 — Suggested Portfolio Allocation by Investor Profile
| Investor Type | Large Cap | Flexicap | Midcap | Debt/Hybrid | Expected CAGR |
|---|---|---|---|---|---|
| Conservative | 50% | 20% | 0% | 30% | 9–10% |
| Moderate | 30% | 40% | 15% | 15% | 11–12% |
| Aggressive | 10% | 30% | 45% | 15% | 13–15% |
| Ultra-Aggressive | 0% | 20% | 65% | 15% | 14–16% |
Key risk insight: Even in worst-case scenarios (major market corrections of 30–40%), long-term SIP investors who stayed invested recovered and outperformed within 3–5 years. The 2020 COVID crash recovery took just 6 months for Nifty 50, validating the SIP stay-the-course strategy.
Table 7 — Tax Efficiency: SWP vs FD vs Dividend Income (2026)
| Income Source | Tax Rate | TDS Applicable | Indexation Benefit | Net Efficiency |
|---|---|---|---|---|
| SWP (Equity >1yr) | 12.5% LTCG above ₹1.25L | No TDS | No (post-2024) | High |
| Fixed Deposit | As per slab (up to 30%) | 10% TDS | No | Low |
| Dividend Income | As per slab | 10% TDS >₹5,000 | No | Low–Medium |
| SWP (Debt Fund) | As per slab | No TDS | No | Medium |
Frequently Asked Questions
Can a ₹2,000 SIP really create ₹1 crore corpus?
Yes — at 15% CAGR over 30 years, a ₹2,000 monthly SIP generates approximately ₹1.40 crore. Even at 12% CAGR, the 30-year corpus reaches ₹70 lakh. Starting early is the single biggest factor.
How much monthly income can I expect from SWP after 30 years?
At 15% CAGR (corpus ≈ ₹1.40 Cr) with an 8% SWP rate, you receive approximately ₹93,000/month. At 12% CAGR (₹70 lakh corpus), SWP income is around ₹46,700/month. Income depends on corpus size and withdrawal rate chosen.
Is SWP taxable? What are the 2026 tax rules?
Under 2026 tax rules, equity fund redemptions held over 1 year attract 12.5% LTCG tax on gains above ₹1.25 lakh/year. SWP spreads redemptions across months, often keeping annual gains below the exemption limit — making it highly tax-efficient versus FDs or dividends.
Which fund category is safest for a 15% CAGR target?
Flexicap and diversified equity funds have historically delivered 13–16% CAGR over 15-year periods. Midcap index funds offer 15%+ with moderate risk. Avoid relying solely on sector or thematic funds for long-term SIP goals.
When should I switch from SIP to SWP mode?
Ideally, switch to SWP 2–3 years before your income target date. Gradually shift 30–40% of corpus to hybrid or debt funds to reduce sequence-of-returns risk. Maintain at least 60% in equity to ensure the corpus keeps growing and sustains long-term withdrawals.
Conclusion
A ₹2,000 monthly SIP is not just a small saving — it is the seed of serious long-term wealth. At 10% CAGR it creates ₹45.6 lakh in 30 years; at 12%, ₹70 lakh; at 15%, a staggering ₹1.40 crore. When converted to SWP, that corpus generates ₹22,000–₹93,000/month in passive income — funded entirely by disciplined investing of ₹2,000/month.
In 2026’s growth-oriented India, with MF infrastructure at its deepest and equity markets poised for a multi-year bull run through 2032, starting your ₹2,000 SIP today — not tomorrow — is the most financially intelligent decision you can make.
Expert Tip: Increase your SIP by 10% every year (step-up SIP). A ₹2,000 SIP with 10% annual step-up at 12% CAGR over 20 years builds ₹52 lakh vs ₹20 lakh without step-up — a 160% difference.