
Index mutual funds have returned an average of 10.51% annually since 1926. Here’s what that means, why it beats 90% of active funds, and what investors usually get wrong.
TL;DR
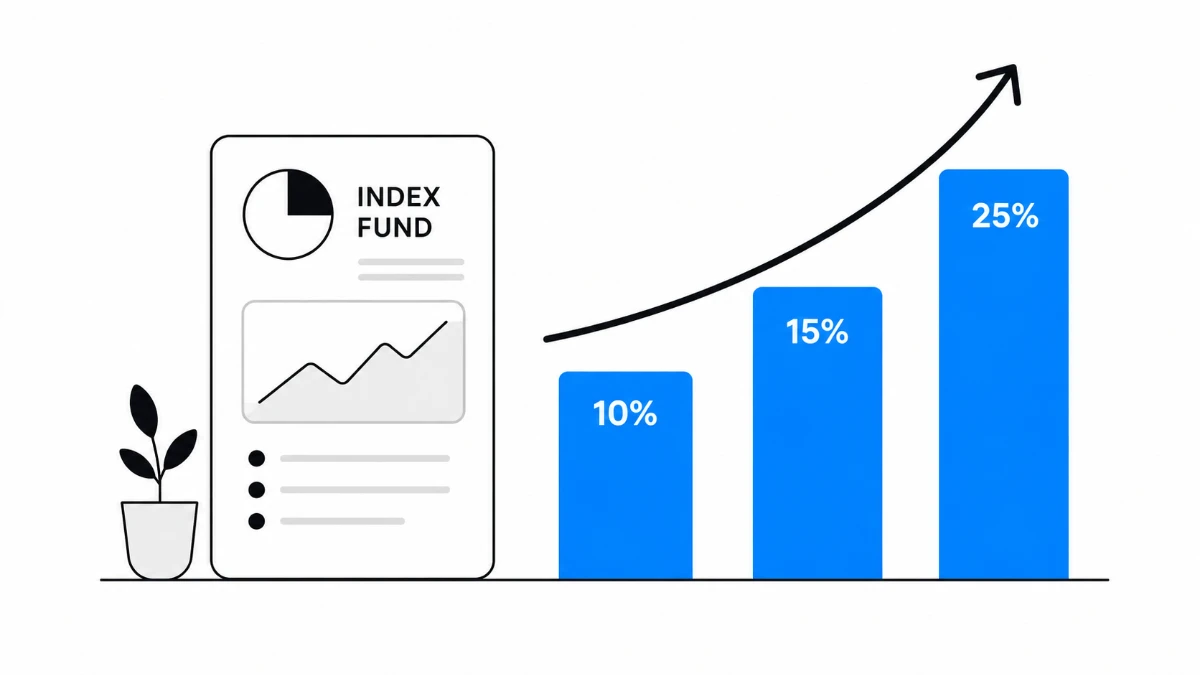
Index mutual funds tracking the S&P 500 have returned roughly 10.51% per year since 1926 – about 6.64% after inflation. Over the 10 years through June 2026, that figure was 15.46% annually for Vanguard’s VFIAX (elevated by a strong market decade). Per the SPIVA scorecard, 89.93% of large-cap active funds underperformed the S&P 500 over 15 years – and there was no category where a majority of active managers beat their benchmark. The case for index funds isn’t controversial anymore; it’s arithmetic. The harder question is whether you’ll stay invested through the years it doesn’t feel like it’s working.
What an index mutual fund actually is
An index mutual fund is a pooled investment vehicle that holds securities to mirror a market index – typically the S&P 500, though there are index funds for small-cap stocks, international markets, bonds, and practically any slice of the market you can name. The fund manager’s job is not to beat the index; it’s to track it as precisely as possible. If Apple makes up 7% of the S&P 500, the fund holds approximately 7% Apple.
That modest job description is the point. Lower turnover means lower transaction costs. No star manager to pay. No research department to fund. The result is an expense ratio that sits around 0.03–0.04% for the leading S&P 500 trackers – a rounding error compared to the 0.4% industry average for active mutual funds, per the Investment Company Institute’s 2024 data.
What the historical returns actually look like
The S&P 500 has delivered an average annual return of approximately 10.51% since 1926, in nominal terms. Adjusted for inflation, that drops to about 6.64% – still a historically excellent result for a passively held, broadly diversified portfolio.
Those averages, though, smooth over years that felt anything but average. A quick look at VFIAX’s annual returns shows what living inside the average actually looks like:
| Year | VFIAX annual return |
|---|---|
| 2025 | +17.83% |
| 2024 | +24.97% |
| 2023 | +26.24% |
| 2022 | -18.15% |
| 2021 | +28.66% |
| 2020 | +18.37% |
| 2019 | +31.46% |
| 2018 | -4.43% |
| 2017 | +21.79% |
| 2016 | +11.93% |
Source: Vanguard VFIAX fund profile
2022 is the tell. The fund dropped 18.15% – not because anything was broken, but because that’s what the market did. Index funds give you the market. The years like 2022 are the cost of admission for the years like 2023 and 2024.
Over a decade, the compounding story is striking: VFIAX’s cumulative 10-year return through June 2026 was 321.16%. A $10,000 investment in 2016 became roughly $42,000.Vanguard VFIAX fund performance page showing 10-year average annual return of 15.46%
Vanguard VFIAX fund page showing current performance data
A note on the 10-year figure: the 2016–2026 window included some of the strongest years in S&P 500 history. The long-run 10.51% is a better planning anchor than the unusually high recent decade.
Why active funds don’t beat this
Here’s the stat that tends to stop people: per the SPIVA U.S. Scorecard for the 15-year period ending December 2025, 89.93% of large-cap active funds underperformed the S&P 500. Not just this year – over 15 years of trying, compounded.
And the pattern isn’t specific to large-cap U.S. equity. The SPIVA data covers 11 regions and multiple asset classes. The scorecard’s summary finding was unambiguous:
“Over the 15-year period ending December 2024, there were no categories in which a majority of active managers outperformed.”
- @CaVivekkhatri, sharing the SPIVA finding on X
No category. Not growth, not value, not small-cap, not international. Collectively, active managers failed everywhere over the long run.

The structural reason isn’t incompetence. Jim Bianco of Bianca Research noted that passive mutual funds and ETFs now represent almost 62% of all equity fund assets. As passive investing grows, the pool of available alpha (the excess return above benchmark) shrinks. Whoever is doing active price discovery is working with less inefficiency to exploit.
This doesn’t mean no active manager ever outperforms. Some do. The problem, as noted by @mmpiatkowski via the Financial Times, is that “one-third of the managers who outperform in any single year are generally not the same as those who win the comparison in the next.” Identifying the future winners in advance – before costs – has proven close to impossible.
The cost compounding you never see
The fee gap between active and index funds sounds small in isolation. 0.04% versus 1%. A rounding error. But compounded over decades, it becomes the most important number in your portfolio.
Run the math on $10,000 growing at 10% annually for 30 years:
- At 0.04% annual expense (index fund): roughly $173,628
- At 1.00% annual expense (active fund): roughly $132,677
- Difference: $40,951 – entirely paid to fund management

The Bogleheads wiki on index funds captures this cleanly: “Low expenses mean that you receive more of the market returns than with higher costs, and your returns compound, rather than being paid to intermediaries. Indexing’s cost advantage builds steadily over long holding periods.”
The major S&P 500 trackers available today illustrate what “low-cost” looks like in practice:
| Fund | Ticker | Expense ratio | AUM |
|---|---|---|---|
| iShares Core S&P 500 ETF | IVV | 0.03% | $699.70B |
| Vanguard S&P 500 ETF | VOO | 0.03% | $771.94B |
| SPDR S&P 500 ETF Trust | SPY | 0.09% | $677.63B |
| Vanguard 500 Index Admiral | VFIAX | 0.04% | $680.5B |
Source: Investopedia S&P 500 funds overview, as of late 2025
The investor behavior gap – the stat most people miss
Here’s the part that tends to get glossed over: even when a fund has excellent returns, the average investor in that fund usually captures far less of it. This isn’t a theoretical risk; it’s documented.
The most striking example is Peter Lynch’s Fidelity Magellan Fund. From 1977 to 1990, Magellan averaged a CAGR of 29.2% – one of the best track records in mutual fund history. Lynch himself later observed that the average investor in his fund made around 7% over that same period.
The explanation: investors chased performance. They bought in after strong years and sold after bad ones, consistently buying high and selling low. A fund return and an investor return are very different numbers.

This is actually one of the strongest arguments for index funds – not just returns, but investor psychology. An index fund doesn’t have a star manager to chase. There’s no narrative that draws people in after a spectacular run. An investor on a low-cost S&P 500 index fund in a long-term account faces less temptation to trade actively.
As one practitioner put it on X:
“I personally eliminate most of these emotional choices, not because I am different from other humans – but just because the product I chose doesn’t allow me to be emotional. It’s like saving my portfolio from my own emotions, which itself is a huge win.”
The concentration risk hiding inside the S&P 500
One thing the 10.51% average doesn’t tell you: what’s actually driving it right now.
The S&P 500’s sector breakdown as of late 2025 shows information technology at 34.8% of the index – higher than at the peak of the dot-com bubble in 2000. The top 10 stocks account for roughly one-third of total market cap. Apple, Microsoft, Nvidia, Alphabet, Amazon, Meta, and Tesla – the “Magnificent Seven” – have driven a disproportionate share of recent returns.
This concentration isn’t inherently dangerous, but it means buying an S&P 500 index fund today is not the same diversification trade it was in the 1990s. A significant tech sector correction, like 2022, ripples through the whole index quickly. The flip side: the 2023–2024 AI-driven tech rally also lifted the whole index.
Whether that concentration is a feature or a bug depends on your view of tech valuations. But it’s worth knowing that “buying the market” now means having a large bet on a handful of megacap technology companies.
Tax efficiency – the return no one talks about
Index mutual funds have one more structural advantage that rarely shows up in performance tables: they generate fewer taxable events than actively managed funds.
Active funds trade frequently – buying and selling positions as the manager’s thesis evolves. Each sale of an appreciated security inside the fund can create a capital gain distribution that gets passed to shareholders and taxed in the year it’s distributed, even if you didn’t sell any shares yourself.
Index funds, by design, have low turnover. They only need to rebalance when the index itself changes – which happens, but relatively infrequently. The result is fewer taxable distributions in taxable accounts. For long-term investors holding outside a tax-advantaged account like an IRA or 401(k), this can represent a meaningful drag avoided.
What a realistic return expectation looks like
The 10-year figure through 2026 (15.46% annually for VFIAX) isn’t the planning assumption to use. The 2020s were an unusually strong decade, and there’s no reason to expect the next decade to replay it.
A more grounded expectation:
- Long-run nominal: ~10% annually – roughly what the S&P 500 has delivered since 1926
- Long-run real (after inflation): ~6.5–7% annually
- Year-to-year variance: significant – 2022 was -18%, 2019 was +31%. The average is calm; the journey is not
If you’re planning retirement income, modeling 7% nominal (roughly the Vanguard’s since-inception return of 8.89% minus a bit of conservatism) is a reasonable base case. Modeling 15% because that’s what the last decade delivered is likely to end poorly.
The honest summary: index mutual funds have consistently returned more than the vast majority of actively managed alternatives, largely because they cost less and don’t require their investors to make correct predictions about which manager will outperform next. That’s a genuinely hard proposition to beat.
